All published articles of this journal are available on ScienceDirect.

The Role of Phenotypic Personality Traits as Dimensions of Decision-making Styles
Abstract
Background:
Each individual has unique personality traits which affect decision-making process. Those traits are defined as cautiousness, openness to experience, decision difficulty, agency, emotion neutrality, goal orientation, intuitive awareness, plan orientation, pro-activity, and rationality.
Objective:
The study aimed to show how established personality traits as dimensions of decision-making can be used to classify four distinct decision-making styles. The personality styles are defined as avoidant, designer, flexible, and auditor styles.
Methods:
A global survey was conducted to gather information on individual decision-making styles. Quantitative methods, such as tabular analysis, mean score equivalency test, correlation analysis, discriminant analysis and chi-square test for association have been used.
Results:
We found that there are significant gender differences in personality styles. This is partially due to the differences in emotion-neutrality scores among men and women. Female respondents are more emotional, a finding that is common in educational workers.
Conclusion:
The results reinforce that gender differences in emotions exist. For a socially interactive occupation such as education, being emotional might lead to better communication.
1. INTRODUCTION
Understanding decision-making styles aims to help researchers and managers understand the phenomenon of why individuals participate in activities that may result in high-risk and possibly damaging outcomes [1]. One may only look as far as the decisions made by professionals in the financial sectors are concerned that resulted in the 2008 global financial crisis, or the British exit from the European Union and seemingly self-destructive decision that leaders make in relation to climate change, to understand why understanding decision-making styles has become a significant aspect of leadership. Within professional sectors, including the education sector, making decisions that will have a significant impact on the lives of people is so commonplace that Lunenburg [2] suggests that it is “a way of life”, that saturates all levels of organisation (from leadership, management, administrators to the grassroots level). Even though research indicates that there is a correlation between the democratisation of decision-making autonomy and positive relationships within the organisation [3], there remains a lack of understanding how decision-making styles influence the dimensions of decision-making and how this has an impact on the development of policy and practices, especially in professions where a sense of purpose and emotion plays a significant role, such as the education sector.
1.1. Personality Traits that Contribute to Possible Decision-making Styles
According to Barry and Steward [4], the role of personality is an important factor in self-managed groups. Decision-making, as a phenomenon in the realm of psychology, has received ample attention [5]. Existing research prefers to place emphasis on the neurological aspects of decision-making or chooses to explore the linear processes of decision-making, rather than a phenomenological approach in which the different decision-making styles are aligned with styles of decision-making. Neuro-biological enquiry places an emphasis on specific areas of the brain and the direct link between decision-making and neurological processes. Conversely, a sequential or linear understanding of decision-making processes elucidates how alternative strategies and how each of these strategies determine the conceivable outcomes per strategy and lean towards comparative estimations that may lead to the desired outcomes based on the consequences of each [6].
Scott and Bruce [1] describe the decision-making as a process of “learned habitual response patterns exhibited by an individual when confronted with a decision situation”. Delineation is drawn between five discrete styles: rational, intuitive, reliant, avoidant and spontaneous. Despite such demarcation, a deeper appreciation of the phenomenon of decision-making processes or style of individuals or groups remains to be explored by either the neuro-biological, sequential or linear or decision-making style approaches. In this article, we propose 10 dimensions of decision-making. These dimensions are connected and derived from the phenotypic personality traits [7] the existence of human agency [8] and self-determination theory [9] that may expound the decision-making process: cautiousness, openness to experience [10], agency [11], decision difficulty, emotion neutrality [12], goal orientation [8], intuitive awareness [13], plan orientation [8], pro-activity [14] and rationality [6]. In our investigation, we measured the aforementioned dimensions from data collected via an online survey of 356 respondents. The results confirm that each dimension is uniquely correlated with the decision-making processes. Significant gender and employment sector differences are clear in regard to emotion-neutrality in decision-making.
1.2. Role of Emotions and Gender on Decision-making
Emotions reflect a combination of conscious and unconscious processes, linked to behaviours that include the decision-making process. Many studies investigated the role of emotional intelligence in life [15-17]. Emotional intelligence is a significant predictor of depressive symptoms [18]. Emotional training is an integral part of education [19]. Negative emotions tend to reduce the effectiveness of the education process [20]. Emotion is the inner sense that generates feelings, and moods that emanate as a result of an experienced stimulus. Humans experience emotions in terms of an evaluative judgment of ‘liking’ or ‘disliking’ a person, situation or an object [21]. Emotions cannot be dissociated from routine situations, including that of the decision-making process. The human experience of emotions may inhibit the efficacy of the individual or group’s decision-making process.
The role of gender in an emotional setting is of great interest. Research suggests that there are existing gender differences that affect the emotional decision-making process [22-26]. However, this is still a controversial subject due to the discrimination faced by female decision-makers. Some studies suggest that the role of female politicians is an integral part of the democratic decision-making process [27-29] and manly emotions are beneficial for men [30, 31]. Some research suggests that age can also be a moderating factor in closing the gender gap in leadership [32, 33]. Nevertheless, being a professional woman comes with additional challenges [34-37]. Stereotyping is the common hurdle faced by female professionals [38-40]. Gender-based occupational factors lead to sustained gender disparities in a professional business and even in education [41-46]. There is also a common belief that stereotyping also exists in emotional settings [47-50]. That is why measuring emotions has become a science itself.
Among psychologists and philosophers, there is a shared impasse on how to demarcate and measure emotions [51]. Measuring emotions, using physical tools, is a substantial struggle for researchers [52] resulting in reliance on self-reporting measures of emotions [53]. According to Ekman and Cordaro [54] “[e]motions are discrete, automatic responses to universally shared, culture-specific and individual-specific events”. Self-reporting, in a twist of irony, is based on incidental mood and is difficult to establish reliability in a test, re-test scenario. Individuals that self-report as emption-reliant are often affected by strong emotional states that either activate or deactivate behaviours, concomitantly impacting how they react to situations where they are required to make decisions. If an individual or a group perceives that preferential outcomes are likely, this triggers emotions resulting in an ‘ amplification that may reflect on our affective responses to positive and negative outcomes’ [55]. Consequently, individuals that self-report as emotion-reliant may look for a solution that feels right, rather than one that is congruent to specific guidelines or desired outcomes. Decisions that feel uncomfortable, yet are more likely to yield the desired outcomes are left by the wayside.
2. MATERIALS AND METHODS
We assumed that there are 10 dimensions of the decision-making process. These dimensions can be listed as cautiousness, openness to experience, decision difficulty, agency, emotion neutrality, goal orientation, intuitive awareness, plan orientation, pro-activity, and rationality. We conducted an online survey designed by Google forms. The survey was posted to online forums. As the survey was conducted online, there was no pressure or motivation to state biased answers. The only motivation for the survey respondents was to help this academic research by their contribution. The survey was completely anonymous with no personal identification possibility. We collected information on the participants' age group, educational attainment, gender, current location, and current occupation. In order to measure the decision-making attributes, we followed a quantitative approach. Specifically, we asked survey participants to rank how they make decisions for each dimension. The answer scale was from 1 (not like me) to 10 (very much like me). Here is how each dimension is measured:
- Cautiousness: I am very cautious when it comes to new experiences.
- Openness to Experience: I feel comfortable following my intuitions when I'm making decisions.
- Agency: I prefer to have complete freedom over making my own decisions.
- Decision Difficulty: Making decisions is difficult for me, I prefer to follow somebody else’s advice.
- Emotion Neutrality: My emotions are neutral and objective when I make a decision.
- Goal Orientation: I am goal orientated and I’m willing to change the plan to achieve the goal.
- Intuitive Awareness: I depend on my intuitive awareness to make decisions.
- Plan Orientation: I am a logical and plan-orientated decision-maker and I don’t like changing the plan.
- Pro-Activity: I prefer being pro-active when making decisions.
- Rationality: I prefer to think about a decision I have to make in a rational way.
Google survey analytics was not enough to perform detailed statistical reporting on the data. Therefore, we used different data analysis and visualization tools to explain our data. Initial data organization was performed with Excel 2016. Minitab software is used to create relevant statistical tables. Finally, Tableau 2018.3 is utilized to create cross tabulation tables and visual analytics.
In terms of demographic information, the age distribution shows normal behaviour. Out of 356 respondents, 103 of them stated that they are around 36-45 years old. Next comes 46-55 interval, followed with 26-35 interval each of which has 86 and 79 respondents, respectively. In terms of gender, our data is similar to that of Karwowski [56]. 204 of all responses were of females; of which 89 were of those working in an education sector. 152 of all responses were of males, of which, 50 were of those working in an education sector. 134 responses were from Africa, followed by Europe (97), America (39), Middle-East [49] and Australasia [37]. Table 1 below shows cross-tabulation of respondents based on different demographic factors (Table 1).
It is worth noting about (Table 1) that while we have data on individual occupations, the sectoral data was highly diversified including administrative positions, agriculture, business and financial operations, computer design, education and training, engineering, entertainment, fashion, government, healthcare, hospitality, legal professions, marketing, media, military, retired, service, student, and even unemployed. However, the number of educational sector workers constitutes almost 40% of the data. Therefore, we decided to combine all other occupational sectors into the “Others” category. That also helped us to test if educational sector workers are more likely to have different personality categories. Similarly, in the original data, the educational attainment had categories such as doctorate degree, post-graduate degree, university degree, secondary school, and technical degrees. In order to see if having a university degree makes a difference, educational attainment has also been categorized. Those with a doctorate degree, post-graduate degree, or at least a university degree have been categorized as University+ whereas those with a secondary school or technical degrees categorized as others.
| Gender / Education (Group) | ||||||
|---|---|---|---|---|---|---|
| – | Female | Male | ||||
| Age | University+ | Other | University+ | Other | Total | % |
| 15 to 19 | 1 | 1 | 0 | 7 | 9 | 2.5% |
| 20 to 25 | 6 | 1 | 11 | 13 | 31 | 8.7% |
| 26 to 35 | 40 | 9 | 27 | 3 | 79 | 22.2% |
| 36 to 45 | 50 | 15 | 34 | 4 | 103 | 28.9% |
| 46 to 55 | 39 | 12 | 27 | 8 | 86 | 24.2% |
| 56 to 65 | 17 | 9 | 12 | 0 | 38 | 10.7% |
| above 65 | 3 | 1 | 6 | 0 | 10 | 2.8% |
| Total | 156 | 48 | 117 | 35 | 356 | 100.0% |
| Geographical Location | ||||||
| Female | Male | |||||
| Geography | University+ | Other | University+ | Other | Total | % |
| Africa | 37 | 21 | 28 | 11 | 97 | 27.2% |
| Asia | 13 | 4 | 20 | 0 | 37 | 10.4% |
| Middle-East | 26 | 3 | 20 | 0 | 49 | 13.8% |
| North America | 22 | 3 | 12 | 2 | 39 | 11.0% |
| Western Europe | 58 | 17 | 37 | 22 | 134 | 37.6% |
| Total | 156 | 48 | 117 | 35 | 356 | 100.0% |
| Occupational Sector | ||||||
| Female | Male | |||||
| Occupation | University+ | Other | University+ | Other | Total | % |
| Education/Training | 80 | 9 | 47 | 3 | 139 | 39.0% |
| Other | 76 | 39 | 70 | 32 | 217 | 61.0% |
| Total | 156 | 48 | 117 | 35 | 356 | 100.0% |
| – | Coding | Mean | Median | Mode | Standard Deviation |
|---|---|---|---|---|---|
| Rationality | Q1 | 8.04 | 8 | 8 | 1.76 |
| Intuitive Awareness | Q2 | 6.95 | 7 | 8 | 2.14 |
| Agency | Q3 | 8.17 | 8 | 10 | 1.88 |
| Cautiousness | Q4 | 6.08 | 6 | 7 | 2.59 |
| Pro-Activity | Q5 | 7.87 | 8 | 8 | 1.73 |
| Emotion-Neutrality | Q6 | 5.68 | 6 | 5 | 2.28 |
| Decision Difficulty | Q7 | 3.61 | 3 | 2 | 2.38 |
| Openness | Q8 | 7.27 | 8 | 8 | 1.99 |
| Goal-Orientation | Q9 | 7.79 | 8 | 8 | 2.01 |
| Plan-Orientation | Q10 | 5.21 | 5 | 5 | 2.42 |
| – | Q1 | Q2 | Q3 | Q4 | Q5 | Q6 | Q7 | Q8 | Q9 | Q10 |
|---|---|---|---|---|---|---|---|---|---|---|
| Rationality | 1.00 | – | – | – | – | – | – | – | – | – |
| Intuitive Awareness | 0.05 | 1.00 | – | – | – | – | – | – | – | – |
| Agency | 0.23 | 0.32 | 1.00 | – | – | – | – | – | – | – |
| Cautiousness | 0.09 | 0.07 | 0.03 | 1.00 | – | – | – | – | – | – |
| Pro-Activity | 0.30 | 0.25 | 0.27 | -0.03 | 1.00 | – | – | – | – | – |
| Emotion-Neutrality | 0.34 | 0.09 | 0.21 | 0.22 | 0.17 | 1.00 | – | – | – | – |
| Decision-Difficulty | -0.07 | -0.09 | -0.22 | 0.21 | -0.30 | -0.13 | 1.00 | – | – | – |
| Openness | 0.08 | 0.52 | 0.37 | 0.04 | 0.29 | 0.13 | -0.12 | 1.00 | – | – |
| Goal-Orientation | 0.25 | 0.20 | 0.26 | 0.02 | 0.39 | 0.20 | -0.23 | 0.31 | 1.00 | – |
| Plan-Orientation | 0.09 | 0.04 | -0.04 | 0.24 | -0.08 | 0.06 | 0.11 | 0.04 | -0.05 | 1.00 |
In the model, we assumed 10 dimensions in the decision-making process. Based on these dimensional measurements, the individuals can be categorized into 4 styles of decision-making. These decision-making styles are avoidant, designer/auditor, flexible, and fluent. A quick statistical analysis of the decision-making dimensions is shown in Table 2.
It is of interest to see whether each dimension is a unique one or redundant. Thus, if some measurements are highly correlated with each other, then these measurements would be redundant. Table 3 shows us the correlation between measured dimensions.
The correlation matrix in Table 3 suggests that each dimension is a unique one. There is almost no correlation between dimensions. The only correlation that is higher than 0.5 is the correlation between the openness (Q8) and Intuitive Awareness (Q2) which is equal to 0.52. However, these dimensions are obviously complementary with each other and can be used to classify the decision-making styles without redundancy. The decision-making dimensions are used to categorize each respondent into a specific personality type. As most answers were clustered at values above the arithmetic means, we first transformed the variables by normalization. The normalized values work as follows:
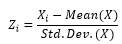 |
(1) |
Here each Zi value refers to the normalized score of decision-making dimension. Xi is the original score (from 1 to 10), mean (X) is the arithmetic mean, and Std. Dev. (X) is the standard deviation. This transformation enables us to see where each decision-maker stands according to other survey respondents.
3. RESULTS
Using 10 dimensions of decision-making, each individual is classified into a specific personality type. The decision-making styles are avoidant, designer/auditor, flexible, and fluent decision-making styles. We tested the decision-making classifications using both linear and quadratic discriminant analysis. According to the linear analysis, out of 356 respondents, the model estimated 303 of them correctly. The quadratic discriminant analysis performed much better. The quadratic model estimated 333 classifications correctly. This translates into a success rate of 93.5%. A summary of classification results is shown in Table 4.
According to the model, 150 of the respondents had fluid type of character, 146 had flexible type character, 31 could be called avoidant, and 29 could be called as designer/auditor style.
The quadratic classification method has correctly identified both avoidant and design/auditor decision-making styles correctly (100% success rate). Out of 146 flexible decision-making styles, 132 were classified correctly; 7 were misclassified as fluid, 6 were misclassified as avoidant, 1 was misclassified as designer/auditor type (90.4% success rate). Out of 150 fluid decision-making styles, 141 were classified correctly; 3 were misclassified as avoidant, 3 were misclassified as design/auditor, and 3 were misclassified as flexible type (94% success rate). These results suggest that personality classification based on decision-making dimensions was very well according to quadratic discrimination analysis.
Based on the above decision-making styles, it is also of interest to see whether associated individual characteristics such as age, educational attainment, gender, geographical location, and occupational sector affect the decision-making styles. Therefore, we tested each of these factors using Chi-square tests for association. For duality purposes, anyone below 35 is classified as a young professional, whereas above 35 is another category. Educational attainment measures whether the individual has a university degree or not. Gender is simply classified as male or female. Geographic location measures whether the individual is located in the western world or not. Occupational sector measures whether the individual is working in an educational institution or in another sector.
The default (null) hypothesis for the effect of each individual characteristic is as follows:
H0: The decision-making style is independent of individual characteristic.
The alternative hypothesis is defined as follows:
Ha: The decision-making style is affected from individual characteristics.
These tests are conducted using Minitab analysis for an association. The computer output also included details on the true and expected number of respondents under each category. However, in Table 5, we report only the simplified results based on analysis:
As can be seen in Table 5, the chi-square tests for association do not suggest any significant relation between decision-making styles and personal socio-demographic characteristics. These findings imply that factors such as age, educational attainment, gender, geography, and occupation do not affect decision-making styles. However, if we consider the significance value of 90% instead of 95%, then gender can be considered as an effective factor in personality. Therefore, it is worth investigating the effect of gender on personality type. Table 6 shows the results for detailed chi-square test for association between gender and personality styles.
| – | True Group | |||
|---|---|---|---|---|
| Put into Group | Avoidant | Design/Auditor | Flexible | Fluid |
| Avoidant | 31 | 0 | 6 | 3 |
| Design/Auditor | 0 | 29 | 1 | 3 |
| Flexible | 0 | 0 | 132 | 3 |
| Fluid | 0 | 0 | 7 | 141 |
| Total N | 31 | 29 | 146 | 150 |
| N correct | 31 | 29 | 132 | 141 |
| Proportion | 1 | 1 | 0.904 | 0.94 |
| – | – | Chi-Square | DF | P-Value | Independent |
|---|---|---|---|---|---|
| Age | Pearson | 0.281 | 3 | 0.964 | Yes |
| Likelihood Ratio | 0.281 | 3 | 0.964 | ||
| Educational Attainment | Pearson | 4.393 | 3 | 0.222 | Yes |
| Likelihood Ratio | 4.532 | 3 | 0.209 | ||
| Gender | Pearson | 7.393 | 3 | 0.06 | Yes* |
| Likelihood Ratio | 7.773 | 3 | 0.051 | ||
| Geography | Pearson | 2.896 | 3 | 0.408 | Yes |
| Likelihood Ratio | 2.914 | 3 | 0.405 | ||
| Occupation | Pearson | 1.875 | 3 | 0.599 | Yes |
| Likelihood Ratio | 1.93 | 3 | 0.587 |
| – | Female | Male | All |
|---|---|---|---|
| Avoidant | 24 | 7 | 31 |
| Expected | 17.76 | 13.24 | |
| Design/Auditor | 15 | 14 | 29 |
| Expected | 16.62 | 12.38 | |
| Flexible | 76 | 70 | 146 |
| Expected | 83.66 | 62.34 | |
| Fluid | 89 | 61 | 150 |
| Expected | 85.96 | 64.04 | |
| All | 204 | 152 | 356 |
| – | Female | Male | Mean Difference |
T-value | P-value | Gender Bias |
|---|---|---|---|---|---|---|
| Rationality | 8.11 | 7.94 | 0.172 | 0.89 | 0.372 | None |
| Intuitive Awareness | 7.09 | 6.76 | 0.330 | 1.44 | 0.150 | None |
| Agency | 8.23 | 8.09 | 0.138 | 0.69 | 0.494 | None |
| Cautiousness | 6.09 | 6.06 | 0.029 | 0.11 | 0.916 | None |
| Pro-Activity | 7.89 | 7.84 | 0.057 | 0.30 | 0.762 | None |
| Emotion Neutrality | 5.46 | 5.98 | -0.524 | -2.15 | 0.032 | Yes* |
| Decision Difficulty | 3.77 | 3.40 | 0.368 | 1.48 | 0.139 | None |
| Openness | 7.24 | 7.32 | -0.087 | -0.41 | 0.684 | None |
| Goal Orientation | 7.75 | 7.86 | -0.117 | -0.54 | 0.586 | None |
| Plan Orientation | 5.17 | 5.25 | -0.078 | -0.30 | 0.764 | None |
The fractional numbers in Table 6 correspond to the expected number of respondents based on probability distribution whereas the integers correspond to the actual number of respondents. For independence, the actual numbers should be as close as possible to the expected numbers. For Designer/Auditor and Fluid decision-making styles, these numbers are very close. However, 24 females and 7 males are classified as avoidant type whereas these numbers are expected to be 17.76 and 13.24, respectively. Thus, female respondents are more likely to have avoidant personality compared to their male counterparts. Similarly, 76 females and 70 males are classified as flexible type, whereas these numbers are expected to be 83.66 and 62.34, respectively. Thus, male respondents are more likely to have flexible personality compared to their female counterparts. These results suggested that gender might be a significant factor in personality classification. Therefore, we decided to test each individual decision-making factor to see if gender differences are significant. The individual test results for each dimension of decision-making are shown in Table 7.
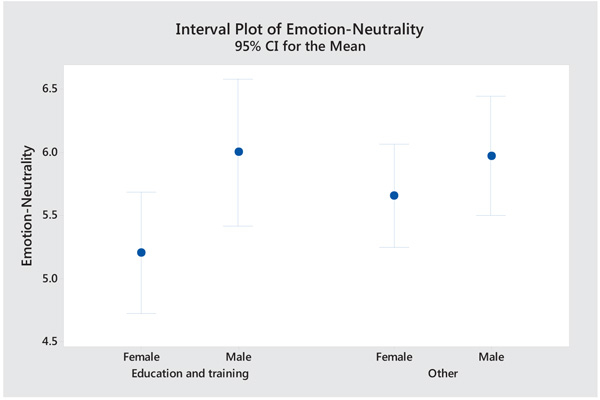
Based on Table 7, one can conclude that there are minor gender differences in decision making process. Female decision makers are slightly more cautious, pro-active, rational, intuitively aware, slightly less comfortable, goal oriented, and plan oriented compared to male decision makers. They also experience higher decision difficulty accompanied with more decision freedom when compared with male counterparts. However, none of these factors are statistically significant. The only significant divergent factor is emotion neutrality. Female decision-makers are less emotion neutral than male decision-makers. Our results in Fig. (1) suggest that this finding is amplified for educational sector workers (teachers, university lecturers, lab instructors, teaching assistants).
The visual in Fig. (1) shows the confidence interval for the mean values. Females are less emotion-neutral compared to male decision-makers. While this factor is insignificant for those who work in other sectors, the gender difference is magnified within the education and training sector. The average emotion-neutrality score for females working in the education sector is 5.2, whereas males have an average emotion-neutrality score of 6. This implies a significant difference of 0.8 points between male and female workers in the education sector. Thus, females working in the education sector are more likely to make emotional decisions.
This result also partially explains the association between gender and decision-making style. As females are more likely to make emotional decisions, they are also more likely to be considered as avoidant, and less likely to be considered as fluent decision-making style. Similarly, the avoidant behaviour is less observed in male decision-makers and they are more likely to fall into fluent decision-making style.
4. DISCUSSION
The results suggest that female participants have a significantly stronger leaning towards making emotion-dependent decisions; a finding that is specifically strong in the education sector. Hutson-Comeaux and Kelly [57] assert that women show more emotional expression, which supports these findings. However, there is no indication in the data that the prevalence of emotion should be mistaken as an antithesis of rationality, which is supported by the findings of Gaudine and Thorne [58] as well as Pulsford, [59]. A stronger emotion-dependent approach to making decisions does not lead to irrationality, conversely, it should rather be considered as an inimitable characteristic of the decision-making process.
It is important to reiterate that emotions are an innate part of the decision-making process [60]. Research suggests that emotional behaviour may as a matter fact contribute to less deleterious decision-making [61]. As the inclusion of emotional intelligence training has become a primary aspect of the corporate ethos [62], the acceptance of emotion as a dimension of decision-making has grown. Specifically, in the educational sector, school leaders who show emotion-neutral decision-making may face opposition from millennial parents who are more versed in the importance of a better student-teacher relationship. This assertion may be of significance when one considers that female teachers are more likely to encourage innovative educational ideas in comparison to their male counterparts. Emotion and gender is another important, if not controversial field of inquiry [63].
Research on the stereotyping of women in the workplace confirms that there remain stereotypical claims that women are more emotional than their male counterparts [64]. Negative stereotyping is a contributing factor to why female workers remain under-represented in management, politics and senior leadership [65-67]. Colloquially known as the glass ceiling, this stereotyping may impede the career progression of female workers [68-71]. In addition, research indicates that scientific fields such as in medical science, being a female doctor can affect a patient’s perceived performance by the medical practitioner [72, 73]. However, there is also research that suggests that where gender diversity of company boards is present, such diversity is not indicative of superior financial performance in these companies [74]. The relationship between gender and race is also of interest [75]. In some studies, the term ‘race’ is replaced by ethnicity [76].
The role of gender differences in emotion dependence may also be accredited to the parochial cultures or even to the ethnicity of the participants in gender-based research [77-79]. Some studies claim that the prejudice against women is prevalent when decision-making takes place in mixed gender groups [80]. The relationship between the gender-role composition of the group and explicit gender role division in group-based decision-making has a significant impact on how emotional dependence in women is perceived [81]. The prevalence of male bias in such research findings is concerning and leads one to question the validity of equal representation in the participant samples of such research.
However, as cracks in the glass ceiling begin to appear, typecasts perceptions of women in the workplace are changing and the gender-gap is shrinking as more women find their way into private and public sector leadership positions as well as taking precedence as active contributors in the economy [82, 83]. Active participation of women workers in the labour market might lead to an organic reduction in gender-differentiated roles within the economy [84]. As an example, entrepreneurs are more likely to encourage family-oriented company policies [85]. Similarly, businesses that encourage women in leadership positions have an increased likelihood to nurture female-friendly policies [86].
4.1. Decision-making in the Education Sector
A significant finding is that emotion-dependence in decision-making in the education sector is more prominent than in the business sector. It is noteworthy to explore the controversy of emotions as a point of contention in the education sector. According to the theory of self-determination, motivation is a phenotypical dimension of success in education [87]. Establishing a professional-emotional student-teacher relationship is an important positive motivational force in the school setting, especially in elementary [88] and fully inclusive schools where special education needs and poverty in the school community are prevalent.
If the findings show that female teachers are more likely to be emotion-dependent in their decision-making style, we must consider how this finding influences the outcomes of female students. Women teachers play a crucial role as role-models in traversing traditional (and perceived) gender boundaries in education [89]. For example, the performances of girls in mathematics courses are not dissimilar than their male counterparts [90]. Thus, the question then remains why there are still a disproportionate number of girls excelling in mathematics and science. We know that gender does not have an influence on the self-efficacy of students at secondary school [91], that said, empirical research by Halberstadt et al. [92] indicates that the acknowledgement of emotions is often subject to the racial and gender bias of teachers. Communication is an essential component of the relationship [93]. Socially facilitative behaviour is more likely to be shown by feminine personalities [94]. However, there might be gender differences in perceived communication [95]. Emotional intelligence does have an impact on the successful outcomes of all students insofar as students with higher emotional intelligence show higher performance in assessments [96].
4.2. Role of Mood Disorders on Emotions
The significance of emotions as a unique human phenomenon and as a dimension of decision-making is a unique contribution to either conscious or unconscious state of mind [97]. Consequently, the role emotions play, as a dimension of decision-making as well as the importance of incidental emotions, the presence of mood disorders and other mental health difficulties merit further investigation.
Incidental emotions tie macro-level phenomena, such as “ambient weather, sport outcomes…[or] the state of the nation” as well as the behaviour of individuals together [12]. To what degree incidental emotions contribute to the efficiency of the decision-making process must yet be explored. In the same way, the pervasiveness on mood disorders and the impact of mood disorders as an impediment to effective decision-making need further clarification. As an example, the use of antidepressants within the education profession has seen significant amplification and an estimated 10% of teachers depend on mood enhancers to cope with workload pressures. In addition, six out of 10 teachers suggest that teaching has a deleterious effect on their mental health [98]. Despite this, Destoop, et al. [99] claim that there is no suggestion regarding the role major depressive disorder plays in the way teachers make decisions concerning fairness and neutrality in the decision-making process. Concurringly, individuals with bipolar disorder are inclined to have low decision consistency and have a propensity towards erratic choices [100]. Such contradiction in decision-making could have a damaging effect on the procedural, administrative and psycho-educational decisions that all pervade the decision-making of teachers on a daily basis. Therefore, we suggest that the impact of mood disorders on the decision-making style of individuals needs further investigation.
CONCLUSION
In this article, we revealed results of an international survey conducted on a global scale. The survey asked respondents to quantify how they make daily decisions. We specifically gathered information on their levels of cautiousness, openness to experience, decision difficulty, agency, emotion neutrality, goal orientation, intuitive awareness, plan orientation, pro-activity, and rationality when making decisions. Despite the survey was conducted anonymously, we gathered socio-demographic information such as age group, educational attainment, gender, current location, and current occupation that provided a deeper understanding of the phenomenon of decision-making. The participants were categorized into four different decision-making styles, based on how they responded to the decision-making dimension questions. These decision-making styles have been listed as avoidant, designer/auditor, flexible, and fluid decision-makers. Of the total participants, 150 were classified as fluid, 146 were classified as flexible, 31 were found to be avoidant, and 29 had a designer/auditor decision-making style. We tested whether personal socio-demographic characteristics such as age, educational attainment, gender, geography, and occupational sector are effective in the construction of decision-making styles. We found that except the gender dimension, these factors are not positively correlated with any decision-making style. Females showed a greater propensity towards having an avoidant decision-making style and less likely to be considered as having a fluent decision-making style. This phenomenon warranted further investigation and we also tested whether there are also substantial differences in decision-making dimensions for women in relation to men. We found that, in terms of emotion neutrality dimension, significant differences exist between female and male respondents; a fact more visible in the education sector.
ETHICS APPROVAL AND CONSENT TO PARTICIPATE
Not applicable.
HUMAN AND ANIMAL RIGHTS
No animals/humans were used for studies that are basis of this research.
CONSENT FOR PUBLICATION
Not applicable.
CONFLICT OF INTEREST
The authors declare no conflict of interest, financial or otherwise.
ACKNOWLEDGEMENTS
Declared none.