All published articles of this journal are available on ScienceDirect.

Development of Mathematical Anxiety Instruments with a Rasch Model Analysis
Abstract
Background:
This study was motivated by a large number of students who feel anxious when dealing with mathematics, which is an unpleasant feeling characterized by the presence of worry, anxiety, confusion, and stress.
Objective:
This study aims to test the instruments of mathematical anxiety using Rasch Model analysis.
Materials and Methods:
The study used descriptive analysis with a cross-sectional design. Subjects of the study were elementary school students in grade VI SDN Margarahayu, 13 male and 5 female students in grade VI A, 9 male and 3 female students in grade VI B.
Results:
The results of the analysis show that the instrument has a poor or not maximum reliability value (α = 0.56). Likewise, the respondent's reliability value (α = 0.49) is in the weak category and the item reliability (α = 0.93) is in the excellent category.
Conclusion:
The analysis of the instrument shows that 2 items do not meet the standard criteria for the measurement, including number 16 as bias genders are more profitable for female students, and number 9 misfits because it is too difficult for most students to agree on. 3 items are categorized as very difficult, including item number P13, P11, and P12. There are 5 items in difficult category, which include numbers P9, P15, P14, P16, and P10. There are 4 items in the easy category, including P6, P5, P4, and P3. While the very easy category has 4 items, including numbers P1, P7, P2, and P8.
1. INTRODUCTION
The development of mathematical anxiety instruments, based on theory [1], states mathematical anxiety as tense and anxious feelings that interfere with the manipulation of numbers in various situations of daily life and academic situations. Students who experience anxiety about mathematics feel that they are unable and cannot learn mathematical material and work on math problems. Mathematical anxiety can develop in the early years of school and become increasingly common with age. It is estimated to affect a proportion of school-age population and adults in post-secondary education. Mathematical anxiety has several negative effects on children and adults regarding mathematics education. In particular, mathematics is one of the subjects that students must master to ensure that they can compensate, adapt, and operate with the advancement of a technology-centered world [2, 3].
It is not clear what factors cause the emergence of mathematical anxiety. However, potential causative factors include environmental variables (for i.e., negative experiences in class, teacher characteristics), intellectual variables (for i.e., levels of abstract or logical thinking), and personality variables (for i.e., self-esteem, learning styles, attitudes, and self-confidence) [2]. Mathematical anxiety can also be influenced by the school system, gender, socioeconomic status, or parents' background [4]. Negative school experiences might also contribute to the development of mathematics anxiety. for i.e., threatening attitudes of teacher can cause a frightening classroom climate where students may hesitate to ask questions or even answer teachers' questions [5].
Especially in a technological society, this can have large-scale implications. for i.e., only 7% of students in the UK take mathematics to level A, and although there are many reasons for this, many students do not like mathematics as an excuse not to continue and sometimes dislike is very intense and filled with emotions. It was also later reported that only 7% of Americans had positive experiences with mathematics from kindergarten to college, and two-thirds of adults admitted that they were afraid and did not like mathematics [2, 6].
Mathematical anxiety is one of the factors which, on one hand, acts as a form of motivation, but on the other hand, it can be an inhibiting factor in mathematical thinking. Not all individuals who are worried about mathematics have the same poor performance in mathematics [7, 8].
Mathematical individuals are usually less fluent in calculations. According to a study [9], there is a negative relationship between mathematics anxiety and mathematics achievement. At all grade levels students with a high matriculation in mathematics anxiety get lower scores in compared to students who have moderate or low mathematics anxiety.
According to another study [10], many studies have been conducted to investigate the levels of math anxiety in elementary and secondary school students, as well as in college students. Some researchers have also found that the mathematical anxiety of elementary school students has a negative correlation performance and results of mathematical learning [8]. Research has shown that mathematical achievements in students is influenced by psychological factors, such as math anxiety. In this context, it appears that many students who are weak in mathematics are worried when trying to use math skills to solve the problem [10].
Based on the PISA data of 2006, Alacaci and Erbas (2010) [11] found that the school and individual characteristics are two of the main characteristics of student's mathematical performance. Referring to a previous study [12], many studies now show that too many students in the United States have a moderate level of mathematical knowledge and a lower level of conceptual knowledge. Therefore, the mathematical strength decreases and the math anxiety increases.
Anxiety over mathematics can not be seen as ordinary, because students' inability to adapt to the lesson causes difficulty and phobia towards mathematics that causes student outcomes and achievement in Low Math Learning [1].
Based on the PISA research in 2015, in students at the age of 15, showed that Indonesias' achievement in mathematical performance was ranked 64 from 72 countries with a score of 386 [13]. Some instructional teaching techniques or common traditional teaching ways can lead to mathematical anxiety, such as setting the same job for everyone, teaching problems through textbooks, insisting on just one true way to solve the problem, and concentrating more on basic skills than the concept of [12].
Previous research, conducted by Hembree in 1990 with his friends, has aroused the interest of educational psychologists towards mathematics anxiety, as reflected in the meta-analysis conducted by Hembree (1990). Besides, researchers have developed a scale of self-report. The most popular scale for measuring math anxiety is the mathematical Anxiety Assessment Scale (MARS). The results of Rasch-using research shows that mathematical anxiety is a specific construction, different from general anxiety and anxiety tests, given that it correlates to being with them and only manifests in specific factors (some of which are not related to judgment or evaluation) [14, 15].
The Rasch model can be used as a method of returning data according to its natural conditions. This natural condition refers to the basic characteristics of quantitative data, which are a continuum. Classical measurement theory that uses raw data as a result of a rating response is unable to present the original characteristics of quantitative data that are a continuum. Through the Rasch model, an ordinal response can be transformed into a ratio that has a higher degree of accuracy about the principle of probability. A study emphasized upon five important parts in the analysis using the Rasch model, including calibration and item estimation capabilities, item characteristic curves in parameter models, information functions of items and instruments, maps of interactions between items and respondents, as well as items and respondents fit/misfit. Based on this, the use of the Rasch model invalidating this instrument will produce more holistic information about the instrument and better meet the measurement definition.
The advantages of Rasch modeling over other methods, especially classical test theory, are the ability to predict data loss based on individual response patterns. These advantages make the statistical analysis results of the Rasch's model to be more accurate in the research done, and more importantly, produce standard error measurement values for the instruments used that can improve the accuracy of calculations [16]. In addition to other advantages of the unique Rasch is that if the data correspond to the model Rasch well, then the estimate of nature and item of difficulty can be obtained independently of the sample, it transform the raw ordinal data into interval size, and provides a variable map that puts people and goods together on latent properties so people can distinguish the sorted structure of the items on the map. Thus, items and levels of one's nature can be compared directly to a variable map [15]. Therefore, to test the math anxiety instrument and acquire the instrument data can use the Help Rasch model through the Winsteps app.
2. METHODS
The study uses descriptive analysis, with a one-time method of dispersing or cross-sectional design that collects data in one timeline to explore students' conception of mathematical judgment and anxiety [8].
2.1. Population and Sample Research
The population that was used as subjects is class VI students in SDN Margarahayu, village Margaluyu, Sukamaju Village, Pagerageung Sub District, Tasikmalaya Regency. As many as 30 students, consisting of 8 female and 22 male students were included. Data was taken with the spread of instruments regarding math anxiety in class VI students. The spread is done in two classes, namely Class VI A and Class VI B. Data retrieval is done in the first lesson hours. In the final result, the data was processed with a model Rasch then analyzed based on student's ability level as well as item about math anxiety. The process of using the Rasch Model to develop a test instrument is through a complete cycle so that the student's response to the statement and data will correspond to the Rasch Model. The process is systematic in which test items are deliberately arranged by the theories that are hypothesized and tested empirically by applying a Rasch model to produce a series of items that meet the requirements (Table 1) [17].
3. RESULTS
The instrument of mathematics anxiety data assessed students of class VI with 16 item statements, analyzed further using the Rasch model through the Winstep program by looking at reliability and validity.
3.1. Instrument Reliability
The results of the instrument reliability analysis performed with the Winstep program are shown in Table 2.
Referring to the Table 2, the person measure 0.12 logit shows the average score of all participants in the working items of the math anxiety instrument item. It provides overall information about the quality of the respondent and the quality of the instruments used between person and item.
The quality of interaction between the person and the item as a whole can be seen from the value of Cronbach Alpha obtained by 0.56, including the ugly category. Next, the Person Reliability value is 0.49 as an indicator of the respondent's response consistency, including the weak category. While Item Reliability is 0.93 which is an indicator of the quality of item in the instrument that it belongs to a good category.
Other data that can be used are INFIT MNSQ and OUTFIT MNSQ in both the Person table and the Item table. Based on the Person table, known average values INFIT MNSQ and OUTFIT MNSQ are 1.01 and 1.00, respectively. Meanwhile, based on the Item table, it is known that the average value of MNFI's INFIT and MNFI's OUTFIT are 0.99 and 1.00, respectively. The criteria is the closer to number 1 the better because the ideal value is 1. An average person and item approach to the ideal criteria can be seen in Table 2, even though the INFIT MNSQ person exceeds the ideal criterion of 0.01 to 1.01, this indicates that the person under study is inconsistent.
Meanwhile, related to INFIT ZSTD and OUTFIT ZSTD, the average values for a person are -0.07 and -0.09, respectively, whereas the values of INFIT ZSTD and OUTFIT ZSTD for each item are -0.09 and -0.05, respectively. The ideal value of ZSTD is 0, the closer it is to 0, the better. Thus it can be said that the quality of the person and items is good.
From the output of (Table 2). known separations for the person is 0.98 and for the item is 3.61. The greater the separation value of the person and the overall instrument quality is better. The separation value is more thoroughly calculated through the formula: H = {(4 x separation) + 1}/3. Thus the separation value for the person is 1.64 rounded to 2, while the separations for the item are 5.15 rounded up to 5. This means that the research participants have a diversity of abilities that can be categorized into two groups. Meanwhile, the difficulty level of item spreads in five groups ranging from the easiest up to the hardest.
3.2. Validity
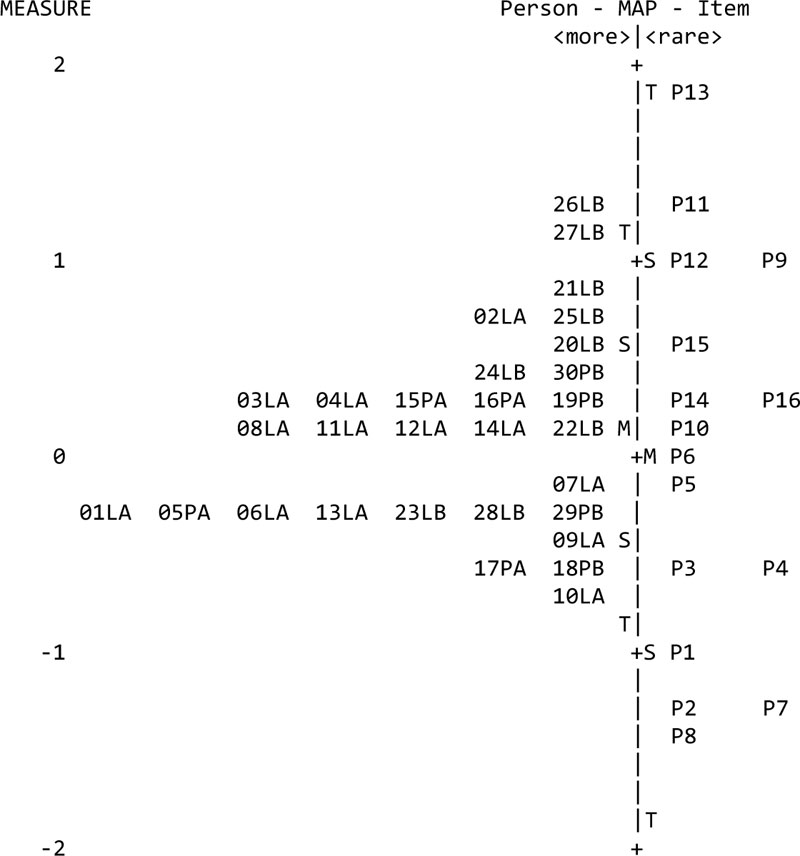
In the analysis with the Rasch model, validity can be more precisely evaluated. Also, we can know which students have low or inconsistent abilities when answering, through Fig. (1).
Referring to Fig. (1), it is revealed that the ability map of Grade VI elementary school students spreads in the range of -2 to 2 logit. Their capability position is largely in between -1SD and + 1SD. Meanwhile, the map of the difficulty level of the item spreads in a range of -2 to 2 logit. The difficult position of 10 items is between -1SD and + 1SD, while 4 items i.e. P1, P2, P7, and P8 are below -1SD. Then as many as 2 items i.e. number P11, and P13 are above + 1SD. Thus item number P11 and P13 have High-level anxiety instruments, similar to items P1, P2, P7, and P8. The average level of anxiety on standard items is below the ability level of grade VI students at SDN Margarahayu. Thus these items of mathematical anxiety instruments are easily approved by the students. This shows that there are students with high abilities and low proficiency.
3.3. The Validity of Respondents and Items
Attempts to inspect respondents and unsuitable items (outliers or Misfits), Sumintono and Widhiarso, in their study [18], suggest three criteria:
a. Outfit Mean Square (MNSQ) values received are: 0.5 <MNSQ <1.5
b. Outfit Z-Standard (ZSTD) values received are: -2.0 <ZSTD <+2.0
c. The value of Point Measure Correlation (Pt Mean Corr) received is: 0.4 <Pt Measure Corr <0.85
Referring to Table 3 and based on the known criteria, as many as 27 students in class VI of SDN Margarahayu are declared fit in the sense of giving answers according to the degree of its ability. While the other 3 answer less according to the level of the ability, namely the numbers 10LA, 28LB, and 09LA. To find out the validity of items, Table 4 is to be observed.
| School Name | Class | M | F | N |
|---|---|---|---|---|
| State Elementary School Margarahyu | VI A | 13 | 5 | 18 |
| VI B | 9 | 3 | 12 | |
| Total | - | 22 | 8 | 30 |
| Entry Number | Total Score | Total Count | Measure | Model S.E. | Infit | Outfit | PT Measure Corr | Al Exp. | Exact OBS% | Match EXP% | Person | ||
|---|---|---|---|---|---|---|---|---|---|---|---|---|---|
| MNSQ | ZSTD | MNSQ | ZSTD | ||||||||||
| 10 | 34 | 16 | -.65 | .33 | 2.46 | 3.33 | 2.77 | 3.59 | A -.09 | .60 | 31.3 | 46.9 | 10LA |
| 28 | 37 | 16 | -.33 | .32 | 2.21 | 2.95 | 2.29 | 2.98 | B .17 | .62 | 18.8 | 43.8 | 28LB |
| 9 | 36 | 16 | -.44 | .32 | 1.59 | .168 | 2.07 | 2.56 | C -.22 | .61 | 56.3 | 45.6 | 09LA |
| 21 | 48 | 16 | .82 | .34 | 1.76 | 1.96 | 1.52 | 1.38 | D .63 | .60 | 37.5 | 49.5 | 21LB |
| 8 | 38 | 15 | .11 | .33 | 1.40 | 1.20 | 1.38 | 1.14 | E .44 | .61 | 46.7 | 42.9 | 08LA |
| 26 | 52 | 16 | 1.30 | .36 | 1.26 | .77 | 1.09 | .36 | F .62 | .56 | 56.3 | 54.9 | 26LB |
| 13 | 37 | 16 | -.33 | .32 | 1.19 | .67 | 1.14 | .52 | G .58 | .62 | 31.3 | 43.8 | 13LA |
| 27 | 51 | 16 | 1.17 | .36 | 1.16 | .56 | .92 | -.10 | H .70 | .57 | 62.5 | 53.8 | 27LB |
| 3 | 43 | 16 | .28 | .32 | 1.15 | .57 | 1.06 | .30 | I .53 | .62 | 31.3 | 44.5 | 03LA |
| 4 | 43 | 16 | .28 | .32 | 1.15 | .57 | 1.06 | .30 | J .53 | .62 | 31.3 | 44.5 | 04LA |
| 29 | 37 | 16 | -.33 | .32 | 1.08 | .34 | 1.06 | .29 | K .70 | .62 | 25.0 | 43.8 | 29PB |
| 23 | 35 | 15 | -.29 | .33 | 1.05 | .25 | 1.02 | .17 | L .73 | .63 | 40.0 | 44.2 | 23LB |
| 6 | 38 | 16 | -.23 | .32 | .95 | -.04 | .93 | -.11 | M .52 | .62 | 50.0 | 43.6 | 06LA |
| 14 | 42 | 16 | .17 | .32 | .94 | -.10 | .95 | -.04 | N .62 | .62 | 43.8 | 44.0 | 14LA |
| 1 | 37 | 16 | -.33 | .32 | .94 | -.09 | .92 | -.15 | O .75 | .62 | 31.3 | 43.8 | 01LA |
| 20 | 46 | 16 | .59 | .33 | .88 | -.29 | .79 | -.56 | o .72 | .61 | 62.5 | 44.0 | 20LB |
| 12 | 41 | 16 | .07 | .32 | .75 | -.74 | .79 | -.58 | n .61 | .62 | 62.5 | 43.8 | 12LA |
| 24 | 41 | 15 | .44 | .33 | .78 | -.61 | .74 | -.72 | m .63 | .60 | 53.3 | 47.2 | 24LB |
| 25 | 47 | 16 | .70 | .33 | .76 | -.66 | .67 | -.98 | l .71 | .60 | 75.0 | 43.1 | 25LB |
| 19 | 43 | 16 | .28 | .32 | .74 | -.79 | .75 | -.74 | k .81 | .62 | 37.5 | 45.0 | 19PB |
| 11 | 41 | 16 | .07 | .32 | .70 | -.93 | .68 | -.98 | j .86 | .62 | 50.0 | 49.1 | 11LA |
| 2 | 47 | 16 | .70 | .33 | .69 | -.94 | .69 | -.89 | i .60 | .60 | 43.8 | 44.5 | 02LA |
| 15 | 43 | 16 | .28 | .32 | .69 | -.97 | .66 | -1.05 | h .75 | .62 | 75.0 | 44.5 | 15PA |
| 16 | 43 | 16 | .28 | .32 | .69 | -.97 | .66 | -1.05 | g .75 | .62 | 75.0 | 43.6 | 16PA |
| 7 | 39 | 16 | -.13 | .32 | .67 | -1.06 | .68 | -.98 | f .91 | .62 | 43.8 | 45.7 | 07LA |
| 17 | 35 | 16 | -.54 | .32 | .57 | -1.48 | .66 | -1.01 | e .61 | .61 | 56.3 | 45.7 | 17PA |
| 18 | 35 | 16 | -.54 | .32 | .57 | -1.48 | .66 | -1.01 | d .61 | .61 | 56.3 | 43.8 | 18PB |
| 5 | 37 | 16 | -.33 | .32 | .55 | -1.57 | .56 | -1.49 | c .78 | .62 | 50.0 | 45.7 | 05PA |
| 22 | 42 | 16 | .17 | .32 | .52 | -1.71 | .54 | -.59 | b .72 | .62 | 43.8 | 44.0 | 22LB |
| 30 | 45 | 16 | .49 | .33 | .35 | -2.62 | .37 | -2.43 | a .93 | .61 | 81.3 | 46.4 | 30PB |
| MEAN 41.1 15.9 .12 .33 P.SD 4.8 .0 .50 .01 |
1.01 -.1 .48 1.3 |
1.00 -.1 .53 1.3 |
- | 48.6 45.6 15.7 2.9 | - | ||||||||
| Entry Number | Total Score | Total Count | Measure | Model S.E. | Infit | Outfit | PT Measure Corr | AL Exp. | Exact OBS% | Match EXP% | Item | ||
|---|---|---|---|---|---|---|---|---|---|---|---|---|---|
| MNSQ | ZSTD | MNSQ | ZSTD | ||||||||||
| 9 | 59 | 30 | .93 | .23 | 1.84 | 3.08 | 2.00 | 3.49 | A -.25 | .38 | 25.7 | 40.1 | P9 |
| 5 | 79 | 29 | -.16 | .23 | 1.36 | 1.52 | 1.38 | 1.58 | B .10 | .38 | 37.9 | 43.1 | P5 |
| 16 | 73 | 30 | .25 | .22 | 1.30 | 1.33 | 1.31 | 1.37 | C .18 | .39 | 40.0 | 41.9 | P16 |
| 7 | 97 | 29 | -.23 | .27 | 1.25 | .96 | 1.08 | .37 | D .56 | .31 | 58.6 | 50.0 | P7 |
| 13 | 44 | 30 | 1.90 | .29 | 1.02 | .17 | 1.22 | .76 | E .04 | .32 | 56.7 | 60.9 | P13 |
| 15 | 67 | 30 | .53 | .22 | 1.20 | .95 | 1.21 | .96 | F .31 | .39 | 36.7 | 41.2 | P12 |
| 12 | 57 | 30 | 1.04 | .23 | 1.02 | .16 | 1.08 | .43 | G .50 | .38 | 33.3 | 40.5 | P2 |
| 2 | 102 | 30 | -1.34 | .27 | 1.02 | .15 | .97 | -.01 | H .34 | .29 | 53.3 | 49.5 | P10 |
| 10 | 74 | 30 | .20 | .22 | .90 | -.39 | .91 | -.38 | h .14 | .39 | 53.3 | 42.2 | P6 |
| 6 | 79 | 30 | -.04 | .22 | .87 | -.54 | .84 | -.71 | g .26 | .38 | 56.7 | 42.9 | P11 |
| 11 | 53 | 30 | 1.27 | .24 | .84 | -.60 | .85 | -.55 | f .45 | .37 | 46.7 | 42.1 | P3 |
| 3 | 90 | 30 | -.59 | .23 | .82 | -.73 | .80 | -.81 | e .61 | .35 | 40.0 | 45.9 | P14 |
| 14 | 73 | 30 | .25 | .22 | .75 | -1.19 | .77 | -1.09 | d .76 | .39 | 33.3 | 41.9 | P8 |
| 8 | 100 | 29 | -1.47 | .29 | 75 | -.87 | .68 | -1.14 | c .65 | .28 | 69.0 | 54.3 | P4 |
| 4 | 89 | 30 | -.54 | .23 | .58 | -2.02 | .57 | -2.02 | b .73 | .35 | 56.7 | 45.8 | P4 |
| 1 | 97 | 30 | -1.00 | .25 | .35 | -3.41 | .39 | -3.41 | a .54 | .32 | 80.0 | 48.0 | P1 |
| MEAN 77.1 29.8 .00 .24 P.SD 17.3 .4 .96 .02 |
.99 -.1 .34 1.5 |
1.00 -.1 .24 1.5 |
- | 48.7 45.7 13.9 5.5 |
- | ||||||||
Based on the 1st criterion, there is known to be 1 item misfit, i.e. number 9 has an OUTFIT MNSQ value of 2.00. According to the 2nd standard, 3 items are misfit, namely the numbers 9, 4, and 1. While based on the 3rd criterion, it is known that as many as 8 items have the value of PT MEASURE CORR more than 0.4 and less than 0.85. Then 8 items do not meet the value of PT MEASURE CORR, namely 9, 5, 16, 13, 15, 2, 19, and 7 that have a value of less than 0.4 so expressed outfit. 1 out of 16 items of the number 9 is declared misfit. Thus, as much as 15 items of math anxiety Item Grade VI Elementary School students expressed fit in the sense of functioning normally, can be understood precisely by students and can measure the math anxiety.
3.4. Item Measure
To know data about the difficulty level of an item, measure item analysis should be used, which can be seen in Table 5.
From Table 5, note the SD value of 0.96. This SD value, if combined with the average value of logit, then the level of difficulty of items can be grouped into categories including difficult (greater +1 SD), hard categories (0.0 logit + 1 SD), easy categories (0.0 logit - 1 SD), and very easy categories (less than -1 SD). Thus, the limit value for the very difficult category is more than 0.96, the hard category is 0.00 to 0.96, the easy category is -0.96 to less than 0.00, and the very easy category is less than -0.96. By looking at the logit value of each item in Table 5 of the column Measure, sequentially based on the level of difficulty (from the most difficult to the easiest) 3 items are categorized as very difficult, namely item numbers P13, P11, and P12. There are 5 difficult categories of items, namely numbers P9, P15, P14, P16, and P10. There are 4 easy categories of items, namely P6, P5, P4, and P3. While in category of very easy items there are 4, namely numbers P1, P7, P2, and P8.
3.5. Person Measure
Individual ability data of math anxiety in grade VI students at SDN Margarahayu can be found from Table 6 Person Measure. From Table 6, SD value of 0.50 is known. The value of this SD if combined with the average value of logit (mean) of 0.12 then the individual ability of students of grade VI SDN Margarahayu can be grouped into categories, including high-ability category is more than 0.62, category of Moderate ability (between-0.38 and-0.62), and the low-ability category is less than-0.38.
By observing the value of each student's logit, then as many as 5 students showed respondents who had the highest mathematical anxiety tendencies compared to others. A total of 21 respondents had moderate mathematical anxiety, and 4 students had a tendency for low mathematical anxiety.
3.6. Detect Bias on Items
The bias of items in this measurement is seen based on gender. An instrument is called a gender bias if one of the individuals with certain characteristics is more profitable than the individual with other characteristics. The bias can be known based on the probability value of items that are below 5%.
Result of bias analysis, based on genders, showed only one item to be biased, namely item number 16 (P = 0.0209). Item number 16 is easier to work with female students, so it benefits female students and tends to harm male students, as can be seen in Table 7.
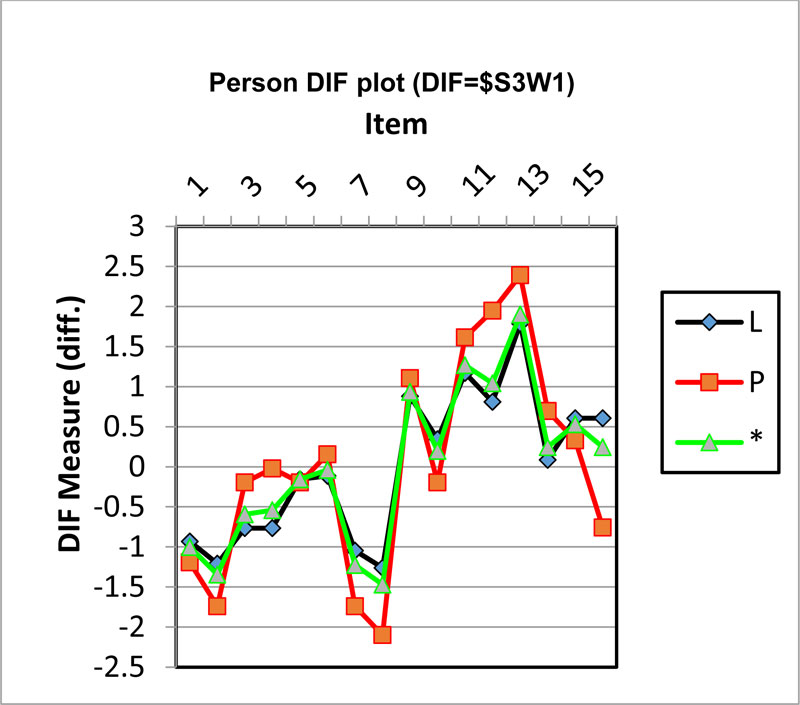
The overall picture of the logit position for each gender-based item can be listed to in the Fig. (2). Judging from the picture that the line between women and men stretches far, that item No. 16 can look easy for women. Therefore, matter number 16 is easier to work with female students so that it benefits female students and tends to harm male students.
| Entry Number | Total Score | Total Count | Measure | Model S.E. | Infit | Outfit | PT Measure Corr | AL Exp. | Exact OBS% | Match EXP% | Item | ||
|---|---|---|---|---|---|---|---|---|---|---|---|---|---|
| MNSQ | ZSTD | MNSQ | ZSTD | ||||||||||
| 13 | 44 | 30 | 1.90 | .29 | 1.02 | .17 | 1.22 | .76 | .04 | .32 | 56.7 | 60.9 | P13 |
| 11 | 53 | 30 | 1.27 | .24 | .84 | -.60 | .85 | -.55 | .45 | .37 | 46.7 | 42.1 | P11 |
| 12 | 57 | 30 | 1.04 | .23 | 1.02 | .16 | 1.08 | .43 | .50 | .38 | 33.3 | 40.5 | P12 |
| 9 | 59 | 30 | .93 | .23 | 1.84 | 3.08 | 2.00 | 3.49 | -.25 | .38 | 26.7 | 40.1 | P9 |
| 15 | 67 | 30 | .53 | .22 | 1.20 | .95 | 1.21 | .96 | .31 | .39 | 36.7 | 41.2 | P15 |
| 14 | 73 | 30 | .25 | .22 | .75 | -1.19 | .77 | -1.09 | .76 | .39 | 33.3 | 41.9 | P14 |
| 16 | 73 | 30 | -.25 | .22 | 1.30 | 1.33 | 1.31 | 1.37 | .18 | .39 | 40.0 | 41.9 | P16 |
| 10 | 74 | 30 | -.20 | .22 | .90 | -39 | .91 | -.38 | .14 | .39 | 53.3 | 42.2 | P10 |
| 6 | 79 | 30 | -.04 | .22 | .87 | -.54 | .84 | -.71 | .26 | .38 | 56.7 | 42.9 | P6 |
| 5 | 79 | 29 | -.16 | .23 | 1.36 | 1.52 | 1.38 | 1.58 | .10 | .38 | 37.9 | 43.1 | P5 |
| 4 | 89 | 30 | -.54 | .23 | .58 | -2.08 | .57 | -2.08 | .73 | .35 | 56.7 | 45.8 | P4 |
| 3 | 90 | 30 | -.59 | .23 | .82 | -.81 | .80 | -.81 | .61 | .35 | 40.0 | 45.9 | P3 |
| 1 | 97 | 30 | -1.00 | .25 | .35 | -3.07 | .39 | -3.07 | .54 | .32 | 80.0 | 48.0 | P1 |
| 7 | 97 | 29 | -1.23 | .27 | 1.25 | .37 | 1.08 | .37 | .56 | .31 | 58.6 | 50.0 | P7 |
| 2 | 102 | 30 | -1.34 | .27 | 1.02 | -.01 | .97 | -.01 | .34 | .29 | 53.3 | 49.5 | P2 |
| 8 | 100 | 29 | -1.47 | .29 | .75 | -1.14 | .68 | -1.14 | .65 | .28 | 69.0 | 54.3 | P8 |
| MEAN 77.1 29.8 .00 .24 P.SD 17.3 .4 .96 .02 |
.99 -.1 .34 1.5 |
1.00 -.1 .37 1.5 |
- | 48.7 45.7 13.9 5.0 |
- | ||||||||
| Person Classes | Summary dif Chi-squared | DF | Prob. | Between-class/Group unwtd | Item Number | Name | |
|---|---|---|---|---|---|---|---|
| MNSQ | ZSTD | ||||||
| 2 | .1957 | 1 | .6582 | .2099 | -.39 | 1 | P1 |
| 2 | .6265 | 1 | .4287 | .6871 | .22 | 2 | P2 |
| 2 | 1.1334 | 1 | .2870 | 1.2676 | .65 | 3 | P3 |
| 2 | 1.9030 | 1 | .1677 | 2.2070 | 1.11 | 4 | P4 |
| 2 | .0084 | 1 | .9272 | .0122 | -1.16 | 5 | P5 |
| 2 | .2752 | 1 | .5999 | .2969 | -.23 | 6 | P6 |
| 2 | 1.0605 | 1 | .3031 | 1.1877 | .60 | 7 | P7 |
| 2 | 1.2580 | 1 | .2620 | 1.4282 | .74 | 8 | P8 |
| 2 | .1632 | 1 | .6862 | .1751 | -.46 | 9 | P9 |
| 2 | 1.0902 | 1 | .2964 | 1.2214 | .62 | 10 | P10 |
| 2 | .4824 | 1 | .4874 | .5284 | .07 | 11 | P11 |
| 2 | 2.5096 | 1 | .1132 | 3.1241 | 1.45 | 12 | P12 |
| 2 | .5266 | 1 | .4681 | .5839 | .12 | 13 | P13 |
| 2 | 1.2995 | 1 | .2543 | 1.4755 | .77 | 14 | P14 |
| 2 | .2925 | 1 | .5886 | .3158 | -.21 | 15 | P15 |
| 2 | 5.3380 | 1 | .0209 | 7.3491 | 2.47 | 16 | P16 |
| Table of standardized residual variance in eigenvalue units = Item information units | |||
|---|---|---|---|
| - | Eigenvalue | Observed | Expected |
| Total raw variance in observations | 27.9118 | 100.0% | 100.0% |
| Raw variance explained by measures | 11.9118 | 42.7% | 42.9% |
| Raw variance explained by persons | 2.0001 | 7.2% | 7.2% |
| Raw Variance explained by items | 9.9116 | 35.5% | 35.7% |
| Raw unexplained variance (total) | 16.0000 | 57.3% 100.0% | 57.1% |
| Unexplained variance in 1st contrast | 3.1403 | 11.3% | 19.6% |
| Unexplained variance in 2nd contrast | 2.5036 | 9.0% | 15.6% |
| Unexplained variance in 3rd contrast | 2.2617 | 8.1% | 14.1% |
| Unexplained variance in 4th contrast | 1.8524 | 6.6% | 11.6% |
| Unexplained variance in 5th contrast | 1.5231 | 5.5% | 9.5% |
The results of this gender bias can be seen from the reliability. The range of errors in reliability is because of lack of a large sample of research, the purpose of a large sample means that the sample can spread from the smartest to the least smart. Usually, the reliability is low because the sample is too small so that the variation of the hierarchy in the logit ruler is also small. Likewise in the items, separation reliability explains how far the measuring instrument can produce a range of measures on the logit ruler. Separation reliability (item or person reliability) would be high if the study sample and grain difficulty level had a wide range and produced a small measurement error. Broad grain means the item has a difficulty level from the easiest to the most difficult.
Therefore, item 16 has to be improved so that it can produce a small measurement error.
| Summary of category structure. Model=”R” | |||||||||
|---|---|---|---|---|---|---|---|---|---|
| CATEGORY LABEL | SCORE | OBSERVED COUNT | % | OBSVD AVRGE | SAMPLE EXPECT | INFIT MNSQ | OUTFIT MNSQ | ANDRICH THRESHOLD | CATEGORY MEASURE |
| 1 | 1 | 86 | 18 | -.95 | -.97 | .99 | .97 | NONE | (-2.38) |
| 2 | 2 | 129 | 27 | -.30 | -.30 | .95 | .93 | -1.05 | -.73 |
| 3 | 3 | 159 | 33 | .38 | .42 | 1.06 | 1.06 | -.15 | .68 |
| 4 | 4 | 103 | 22 | 1.13 | 1.09 | 1.01 | 1.05 | 1.20 | (2.46) |
| MISSING 3 1 | 1.04 | - | - | - | - | ||||
3.7. Unidimensionalities
To identify how many attributes or dimensions are measured by the instrument, a unidimensionality analysis, by paying attention to the value of raw variance explained by measures and unexplained variance in 1st to 5th contrast, is carried out. Unidimensionality of measurement can be proven if raw variance is explained by measures ≥ 20% (Note: general criteria for interpretation are: sufficient if 20-40%, good if 40-60%, and very good if above 60%) and if unexplained variance in 1st to 5th contrast of residuals is <15% each.
From Table 8, it can be seen that the raw variance measurement results are 42.7%, including the good category. This shows that the requirements for unidimensionality can be fulfilled. Whereas the unexplained variance were 11.3%, 9.0%, 8.1%, 6.6% and 5.5%, respectively. It appears that each of them is less than 15%. Thus the construction of the instrument used measures one variable, the identity of mathematics anxiety in elementary school.
3.8. Rating Scale Diagnostic
A rating scale is a test done to verify whether the options used are confusing for the respondent. The spread of mathematical anxiety instruments using the Likert scalecan be seen in Table 8.
It appears that the average observation starts from logit -0.95 for option 1, for option 2 -0.30 logit, option for 3 +0.38 logit, and for option 4 +1.13. The increase in the value of the logit shows consistent results.
Therefore, it shows that the scale of the 1-4 rating can be said to be not confusing for the respondent and also the value of Andrich threshold moving from NONE to negative and lead to positives sequentially indicating that the four options provided are already valid for respondents.
4. DISCUSSION
Based on the results of the analysis with Rasch modeling, it is known that the math anxiety item provides consistent results, proven by measuring one variable (unidimensional. The Math anxiety instrument contains a statement related to the student's condition, in findings of a research [13], student's mental health conditions are a major factor in analyzing the learning difficulties of the students. The important factor comes from the student's anxiety condition to mathematics, causes strain on the students.
Vinson [19] argues that “mathematical anxiety is more than dislike of mathematics”. Mathematical anxiety involves feelings of tension and anxiety that interfere with the manipulation of numbers and solving mathematical problems in daily lives and academic situations. Math anxiety is defined as a negative emotional response that arises when faced with a mathematical task, raising anxiety, in particular, a feeling of panic and helpless [20].
In line with I. G. Sarason and Stoops [21], the cognitive poll can be adapted to assess how high-anxious and low-anxious children may differ in their thought processes as they perform evaluative tasks and how the difference changes over time.
Out of the 16 items analyzed, 10 items match the model. However, items included in the category have not been maximized (ugly). This data is derived from the alpha value. This alpha value is a measure of the reliability of the interaction between the respondent and the overall item. The result of the alpha reliability is 0.56, which indicates that the mathematical anxiety scale in grade VI students does not have maximal reliability (ugly). This means that the instrument is not in line with the student's response, or the student does not understand the contents of the instrument so that some children do not work properly. According to a previous study [22], there are many positive or negative factors affecting a person gaining mathematical skills, such as age, developmental level, needs and interests, intelligence level, health situation, teacher factors, school start age, and attitude towards maths coursework. The reason for math anxiety is usually classified as environmental, personal, or cognitive. Environmental causes may include negative experiences in the mathematics class or with certain mathematical teachers. Personal causes include low self-esteem, less confidence, and the influence of previous negative experiences, as well as intimidation can also affect students who are anxious in mathematics. Intellectual factors affecting mathematical anxiety include learning styles, diligence, self-doubt, and dyslexia. The innate characteristics are due to low intelligence or poor cognitive ability in mathematics [9, 23].
Research findings [24, 25] suggest that some math-anxious individuals tend to move away or dodge the math classes and avoid learning math. When faced with mathematical tasks, anxious individuals of mathematics tend to worry about the situation and its consequences. Math anxiety has consistently proved to be negatively related to mathematical achievements like school math scores. Math anxiety is also linked to behavioral avoidance, such as avoiding mathematical coursework as well as cognitive involvement in mathematical tasks. Finally, math anxiety develops from childhood and may become very dangerous during adolescence [26].
Furthermore, the reliability coefficient of mathematics anxiety item is good at 0.93, this means that the quality of items in the instrument is good. Different from the person reliability, including the weak category because it is in logit 0.49. This suggests that the respondent, in this case, the students, did not answer in earnest. In a study [27], the dominant view is that the low self-concept of ability is a source of high mathematical anxiety. If anxiety levels increase too high, students may not be able to do well [28].
The instrument's answer options can be seen from Table 8. The result of the answer option of mathematical anxiety instruments on a 1-4 scale is not confusing for respondents. Thus, the use of Likert scale data, in principle, can be used as the basis for obtaining an estimate of the interval level on the continuum by implementing a Model Rasch [29].
Based on the results of the analysis, there are 4 items identified not exactly by the model or identified as having a low level of difficulty. In other words, the four items need to be dropped. Among them are item number P1, P2, P7, and P8, and these items are located at Logit-1.00,-1.34,-1.23, and-1.47, repectively. Furthermore, results of the analysis of ten appropriate items, known as the most difficult items approved by the respondent, in this case is item number 13. This item has the highest Logit value, which is 1.90 logit. This item seems to be the hardest to approve by students because of the element of hope.
The findings of this study are consistent with the results of other researches [1, 3, 23]. Parents usually set very high hopes and expectations for their children. They hope their children get good math grades. There are conditions where mathematics is taught in a tense classroom. This could be by the way of teaching, models, and methods of teachers that might influence students with negative attitudes and beliefs of teachers towards mathematics, as well as parents of students who sometimes force their children to be good at math. Primary school children are greatly influenced by adult attitudes. “Thus that in grades one and two, girls are more likely to be influenced by their teacher's anxiety than their male classmates brand the word Beilock” in [30].
Based on the analysis, some items contain bias, namely item number 16 (p = 0.0209). Item number 16 is easier for female students to work on so that it benefits girls and tends to disadvantage male students. Gender differences affect mathematics learning occurring during elementary school age. Men are more interested in mathematics compared to female students, so female students are more anxious in dealing with mathematics and also have a stronger negative reaction to mathematics than male students [31, 32]. This finding is in line with the results of a study [10] that women have higher mathematical anxiety than men. Besides, female students are often labeled shy and this characteristic can damage their ability to learn. This is not because women have lower intellectual levels than men, but because of the factor of trust among female students in mathematics. Female students report that they cannot understand and solve mathematical problems that they have learned before.
In addition to containing bias, there is a misfit item, which is number 9, where the item on the value of the point measure correlation is negative that is -0.25. So items are recommended to be eliminated. By looking at the logit value of each item in sequence, based on the level of difficulty, 3 items are categorized as very difficult, namely item number P13, P11, and P12. There are 5 items in difficult categories, namely numbers P9, P15, P14, P16, and P10. There are 4 items in easy categories, namely P6, P5, P4, and P3. While the ‘very easy’ category has 4 items, namely numbers P1, P7, P2, and P8.
Finally, regarding the suitability of the respondents with the items, there were 27 Grade VI students declared fit in the sense of giving answers accordingly, while 3 students answered incorrectly. Therefore it can be seen that from 30 students, as many as 5 students showed respondents the highest mathematical anxiety tendencies. A total of 21 had a moderate mathematical anxiety tendency, and students with a low mathematical tendency were 4 in number. Studies show that mathematical anxiety was found in elementary school students, secondary school students, and college students. Math anxiety is one of the factors affecting student learning achievement. Therefore, teachers should strive to understand the anxiety of mathematics and implement a teaching-learning strategy so that students can cope with their anxiety [9, 10].
Jackson and Leffingwell in their work [33] noted that if a student has a bad experience during school, mathematical anxiety will continue to reappear later on. To improve students' academic achievement by increasing their positive attitude towards mathematics, there are many research-oriented methods. Among them different methods such as music, computers, narration, imitation, visualization, multiple intelligence can be done [34].
CONCLUSION
The results of data analysis from instruments that have been analyzed or developed can be used, but need to look for respondents with suitable individual abilities. Based on the analysis, it can be seen that the results of the reliability of the instrument on the item of 0.93, include the excellent category. So from this study, the instruments used to find out mathematics anxiety in students can be seen. A total of 5 students showed respondents the highest mathematical anxiety tendency. From this action, the teacher is expected to motivate students to like mathematics and there is no need to doubt or fear when facing math problems or lessons. The teacher must try to understand mathematics anxiety and implement teaching and learning strategies so that students can overcome their anxiety.
The research sample, used in this study, is still too small, therefore,the results obtained are only a few, namely 5 people from 30 students who experience mathematical anxiety. If the research sample is more than 30 students, the results will be accordingly.
Thus, the items sufficient to be used in the instrument of revealing the data on the mathematics, in students of class VI of SDN Margarahayu, are 14 items. With the difficulty levels classified as very difficult, difficult, easy and very easy. The answer choice scale has been understood by students, namely 1, 2, 3, and 4. The average level of difficulty for standard items is below the level of ability of Grade VI students at SDN Margarahayu. Thus these mathematical anxiety instrument items are easily approved by grade VI students of SDN Margarahayu.
This research is useful to know the level of mathematics anxiety in students, and how students deal with mathematics. Teachers must always monitor their students when learning takes place to understand the material that has been delivered. Anxiety factor towards learning mathematics gives the highest contribution to the ability of mathematical connections, this is caused by the learning conducted by researchers, which requires students to recall the material that has been learned and be able to connect it with the material being studied, in this learning, students are trained to abandon their habits to just memorize the mathematical formula and replace it with learning to understand and interpret mathematical concepts and formulae and do more practice exercises. And this process requires time for students to adapt.
ETHICS APPROVAL AND CONSENT TO PARTICIPATE
Not applicable.
HUMAN AND ANIMAL RIGHTS
Not applicable.
CONSENT FOR PUBLICATION
Informed consent was obtained from all the participants when they were enrolled.
AVAILABILITY OF DATA AND MATERIALS
The data shall be shared on request to the corresponding author [D.S] upon reasonable request.
FUNDING
None.
CONFLICT OF INTEREST
The author declares no conflict of interest, financial or otherwise.
ACKNOWLEDGEMENTS
Thank you to the Learning Evaluation course for providing the opportunity to create this article.