All published articles of this journal are available on ScienceDirect.

Students’ Confidence Instrument Analysis in Poetry Learning through Rasch Model
Authors Info & Affiliations
Abstract
Background:
Students' low confidence becomes the reasons for conducting this research whereas it is one of the most important skills needed to develop ability and potency.
Objective:
This research aims to obtain information about Students' confidence levels in Bahasa Indonesia's subject, especially in poetry learning.
Materials and Methods:
This research employed a cross-sectional study with the quantitative approach. Participants of this research were 45 fifth grade students in Cibeureum Elementary School and 50th grade students in Kotabaru Elementary School 2019/2020 academic year. The self-report questionnaires were used as a research instrument to measure Students' confidence levels with the cluster sampling technique. Data were analyzed using the Partial Credit Model (PCM). These parameters are identified with the category coefficients and the scoring function of the Rasch model for polychotomous responses in which the latent trait is assumed uni-dimensional.
Results:
The trial results showed that as many as 13 items proved to be compatible with PCM instruments, the reliability of the instrument was 0.74, the item difficulty index started from -0.36 to 0.36 which meant that all items in the category were sufficient.
Conclusion:
This development instrument is valid and really measures the effect of student confidence on poetry learning, so it can be used to measure student confidence in poetry learning.
1. INTRODUCTION
The learning of Bahasa Indonesia in the National Curriculum, Curriculum 2013, is focused on developing competencies in the realm of attitudes, knowledge, and skills. The main concept for the development of the Curriculum 2013 is text-based teaching, which aims to enable students to create and use text according to social goals and functions. In textbased language learning, Bahasa Indonesia is taught not only as language for knowledge, but also as text that serves to be self-actualization of its use in social and academic contexts [1].
Poetry learning is one form of student’s self-actualization. Poetry learning can help students to express their moods, to understand their own feelings, to provide excitement, to obtain knowledge about the concept of the world around the students, and to uncover and foster student's sensitivity and insight to the environment [2]. In other words, through the learning of poetry, students can develop their potential.
The learning of poetry in Indonesia has not yet obtained the optimal results in the implementation of learning in schools. The results of the study [3], showed that in SD Negeri 075019 Dahana Tabaloho, implementing the learning of Bahasa Indonesia results were less than optimal. As for what might be a problem in the poetry learning process, this learning is difficult for the teacher too, due to the teacher's inadequate ability, in terms of both knowledge and how to teach it. According to a few studies [3-5], the problem in poetry learning is that (1) the teachers only gives lectures and theories, (2) they do not develop the learning methods and the media to teach, (3) there is a lack of developing learning strategies, (4) they do not provide the opportunity to develop the competencies of the students, and (5) they only give an explanation without practice/skills.
Based on those issues, the student's ability to write poems is also not satisfactory yet. This is evidenced through the results of the research [6], which shows that the average value of the ability to write poems for fifth grade students at SDN 104204 Sambirejo Timur is still low. The deficiencies contained in poems that students produce include; students have not been able to determine written ideas and develop them, many students are found to be inaccurate in vocabulary selection, and most students still need a long time to write poems.
Beside the teaching problems, the students’ issues also become a challenge in poetry learning. The main problem faced by students in learning poetry is boredom, and the feeling that writing poems is difficult. In addition, the ability, interest, and self-confidence basically have a considerable influence in supporting the process of learning poetry. Therefore, the teachers require to be able to overcome the situation and try to find a way out for the students to be happy when learning poetry. The results of Trends in International Mathematics and Science Study [5] show that student confidence in Indonesia is still low, which is below 30%. Therefore, this research emphasizes more about student's self-confidence.
Self-confidence is a very important provision that must be owned by everyone. With self-confidence, a person is able to develop the capabilities and potential he has. Therefore, confidence is an important aspect in the development of students in school [7]. Moreover, to face increasingly fierce global competition, of course one cannot only rely on the aspect of knowledge alone, but must have the confidence and courage to face any global challenges. Self-confidence is not a thing that a person has since birth, but self-confidence can be developed.
Self-confidence can be developed if students carry out self-confidence related activities in school, such as dare to ask the teacher when having difficulties in understanding a material, dare to express opinions when learning takes place, active in group assignments and group discussions, optimistic in solving problems, as well as completing homework without seeing the work of a friend. Therefore, things that must be highlighted in growing students’ self-confidence include active, courage, social relations, responsibility and self-actualization [8].
Thus, this study aims to look at the effect of self-confidence on students’ poems through instruments and analyzed through the Rasch Model, so that it becomes a teacher's consideration to be able to develop student's abilities in improving the quality of students’ poems.
2. METHODS
This study employs a quantitative approach because it examines the relationship between variables and research instruments, so data can be analyzed through statistics [9]. This type of research is descriptive, with a one-time deployment method or cross-sectional design that collects data at a time to explore student's conceptions of students’ assessment and self-confidence.
In this research, Rasch Model is used to analyze the results of the instrument. The Rasch Model has the advantage of producing a measurement scale with the same interval so that it can provide accurate information about the participants as well as the quality of the work [10]. This research does not use the classical model because the items produced by the classical model change depending on the ability of participants [10]. Thus, the researchers use the Rasch Model to analyze instruments because this model can provide solutions to overcome the shortcomings or limitations of the classical model [11].
Analysis of the data of this study used Partial Credit Model 1 PL (PCM 1PL) for testing the fit items of student's self-confidence tests for poetry learning. The basic consideration used, the first is that PCM as an extension of the Rasch Model which is a 1-PL model, can use a sample that is not as large as calibrating polychotomous data using a 2-PL or 3-PL model [12]. Second, that the response characteristics to the items confidently follow PCM.
PCM is a development of the Rasch Model dichotomous item which is applied to polychotomous items. The Rasch model of the dichotomous item containing only one item location parameter (difficulty level) was then developed by describing the location of items into several categories. The assumption on PCM is that each item has the same different power. PCM is similar to the Graded Response Model (GRM) on items that are scored in the tiered category, but the difficulty index in each step does not need to be sequential, a step can be more difficult than the next step [13]. This means, PCM is the development of the Rasch dichotomous model into a polychotomous with one logistical parameter, namely the level of difficulty.
The category score on PCM shows the number of steps to complete the item correctly. A higher category score indicates a greater ability than a lower category score. In PCM, if an item has two categories, the probability equation becomes the Rasch equation model [14]. Therefore, PCM can be applied to polychotomous and dichotomous grains.
2.1. Population and Research Samples
The participants of the research were fifth grade students of SDN Cibeureum, Tasikmalaya City, including 45 students, with 16 women and 29 men, and fifth grade students of SDN Kotabaru, Tasikmalaya City, including 50 students, with 31 women and 19 men. These data were taken by distributing instruments of student's self-confidence in learning poetry in fifth grade. The distribution of each school was carried out in two classes, namely class V-A and class V-B. In the final result, the data were processed with the Rasch Model, and then the data were analyzed based on the level of student ability and items about student's confidence in poetry learning. The process of using the Rasch Model to develop test instruments was through a development cycle so that student's responses to statements and data will be in accordance with the Rasch Model. The process is a systematic process in which the test items are deliberately arranged according to the theory hypothesized and empirically tested by applying the Rasch Model to produce a series of items that meet the Rasch Model requirements [15]. The research sample can be seen in Table 1.
2.2. Research Variable
The variables investigated in this study were activities that involve student confidence in school based on theory [8, 16] which consists of 5 aspects, including:
1) Active, namely a person's activities related to physical and mental.
2) Courage, which is the attitude of someone to do something.
3) Social relations, namely the relationship between one person and another person.
4) Responsibility, i.e.one's awareness of his actions.
5) Self-actualization, which is a person's highest achievement.
Then, the five aspects were developed in 13 items of confidence instruments, with a 4-point Likert scheme, starting from very inappropriate, inappropriate, appropriate, and very appropriate.
3. RESULTS
The research results examined the empirical data on the confidence instrument used as a basis and consideration for obtaining information about the fifth-grade student's confidence in elementary school towards Bahasa Indonesia subject, especially on poetry learning. The instrument of revealing the confident data of fifth-grade students with a total of 13 statement items was further analyzed using the Rasch model through the Winstep program by looking at reliability and validity.
3.1. Instrument Reliability
The results of the instrument reliability analysis conducted with the Winstep program are shown in Table 2.
| School Name | Class | M | F | N |
|---|---|---|---|---|
| State Elementary School Cibeureum | V A | 15 | 8 | 23 |
| V B | 14 | 8 | 22 | |
| State Elementary School Kotabaru | V A | 11 | 15 | 26 |
| V B | 8 | 16 | 24 | |
| Total | - | 48 | 47 | 95 |
| SUMMARY OF 95 MEASURED (NON-EXTREME) Person | ||||||||
|---|---|---|---|---|---|---|---|---|
| - | TOTAL SCORE | COUNT | MEASURE | MODEL S.E. | INFIT | OUTFIT | ||
| MNSQ | ZSTD | MNSQ | ZSTD | |||||
| MEAN | 39.3 | 13.0 | 1.16 | .48 | 1.01 | -.33 | 1.01 | -.34 |
| SEM | .5 | .0 | .11 | .01 | .08 | .20 | .08 | .20 |
| P.SD | 4.7 | .0 | 1.06 | .07 | .77 | 1.92 | .76 | 1.93 |
| S.SD | 4.7 | .0 | 1.07 | .07 | .77 | 1.93 | .77 | 1.94 |
| MAX. | 51.0 | 13.0 | 5.03 | 1.04 | 3.48 | 3.78 | 3.46 | 3.78 |
| MIN. | 26.0 | 13.0 | -1.27 | .38 | .04 | -5.73 | .04 | -5.67 |
| REAL RMSE .55 MODEL RMSE .49 S.E. OF Person MEAN= .11 |
TRUE SD .91 TRUE SD .94 |
SEPARATION 1.64 SEPARATION 1.93 |
Person RELIABILITY .73 Person RELIABILITY .79 |
|||||
| SUMMARY OF 13 MEASURED (NON-EXTREME) Item | ||||||||
|---|---|---|---|---|---|---|---|---|
| - | TOTAL SCORE | COUNT | MEASURE | MODEL S.E. | INFIT | OUTFIT | ||
| MNSQ | ZSTD | MNSQ | ZSTD | |||||
| MEAN | 289.2 | 95.0 | .00 | .18 | 1.00 | -.08 | 1.01 | -.03 |
| SEM | 3.4 | .0 | .11 | .00 | .07 | .45 | .07 | .43 |
| P.SD | 11.7 | .0 | .36 | .01 | .24 | 1.55 | .24 | 1.48 |
| S.SD | 12.2 | .0 | .38 | .01 | .25 | 1.61 | .25 | 1.54 |
| MAX. | 306.0 | 95.0 | .69 | .19 | 1.56 | 3.12 | 1.57 | 3.14 |
| MIN. | 266.0 | 95.0 | -.54 | .17 | .61 | -2.89 | .63 | -2.71 |
| REAL RMSE .19 MODEL RMSE .18 S.E. OF Item MEAN = .11 |
TRUE SD .31 TRUE SD .32 |
SEPARATION 1.69 SEPARATION 1.80 |
Item RELIABILITY .74 Item RELIABILITY .76 |
|||||
From Table 2, a person measures 1.16 logit showed the average score of all participants in completing the items. The average person value was higher than the average item (0,00 logit), which indicated that the participants' ability was generally higher than the instrument item difficulty.
Cronbach Alpha value, which represented the interaction between person and items as a whole, was 0.81, and categorized as very good. Person Reliability value was 0.73 as an indicator of the consistency of the respondents' answer, it was categorized as sufficient, while the Item Reliability of 0.74 as an indicator of the instrument item quality, was categorized as sufficient.
The other data that can be used were MNSQ INFIT and MNSQ OUTFIT, both on the Person table and Item Table 3. Based on the Person Table, the average value of MNSQ INFIT and MNSQ OUTFIT were 1.01 and 1.01, respectively, while, based on the Item Table 3, the average value of MNSQ INFIT and MNSQ OUTFIT were 1.00 and 1.01, respectively. The criteria, the better value is closer to number one since the ideal value is one. Thus, the average person and item had approached the ideal criteria.
Meanwhile, related to INFIT ZSTD and OUTFIT ZSTD, the average values for the person were -0.33 and -0.34, respectively, while the value of INFIT ZSTD and OUTFIT ZSTD for each item were -0.08 and -0.03. The ideal ZSTD value is 0, the better value is closer to 0. Thus, it can be said that the person and the quality of the item is good.
From Table 2, the separation for the person was 1.64 and for an item was 1.69. The higher the separation value, the better the overall quality of the person and instrument. Separation values were calculated more precisely through the formula: H = {(4 x separation) + 1} / 3. Thus, the separation value for the person was 2.52 fulfilled to 3, while the separation for an item was 2.58 fulfilled to 3. This means that the participants in this research have a variety of abilities that can be categorized into three groups. Meanwhile, the item difficulty level spread in three groups started from the easiest to the most difficult groups.
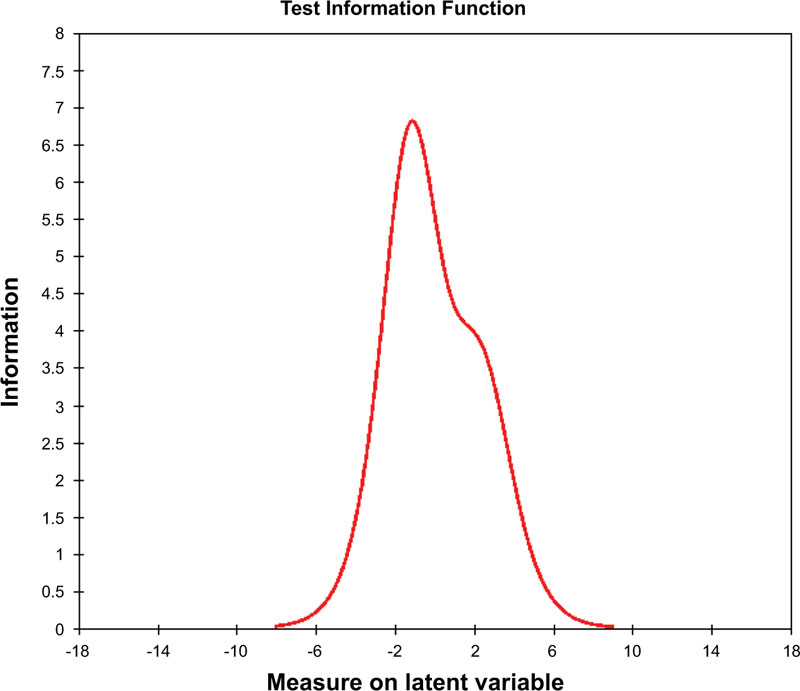
Related to the information on measurement results or measurement focus, the picture was obtained as shown in Fig. (1).
The figure indicated that the items of student's confidence were more likely to produce high information on students with average and low-level ability.
3.2. Validity
In the analysis with the Rasch model, validity can be evaluated more precisely. Besides that, we can find out students who have low or inconsistent abilities when answering, can be seen in Fig. (2).
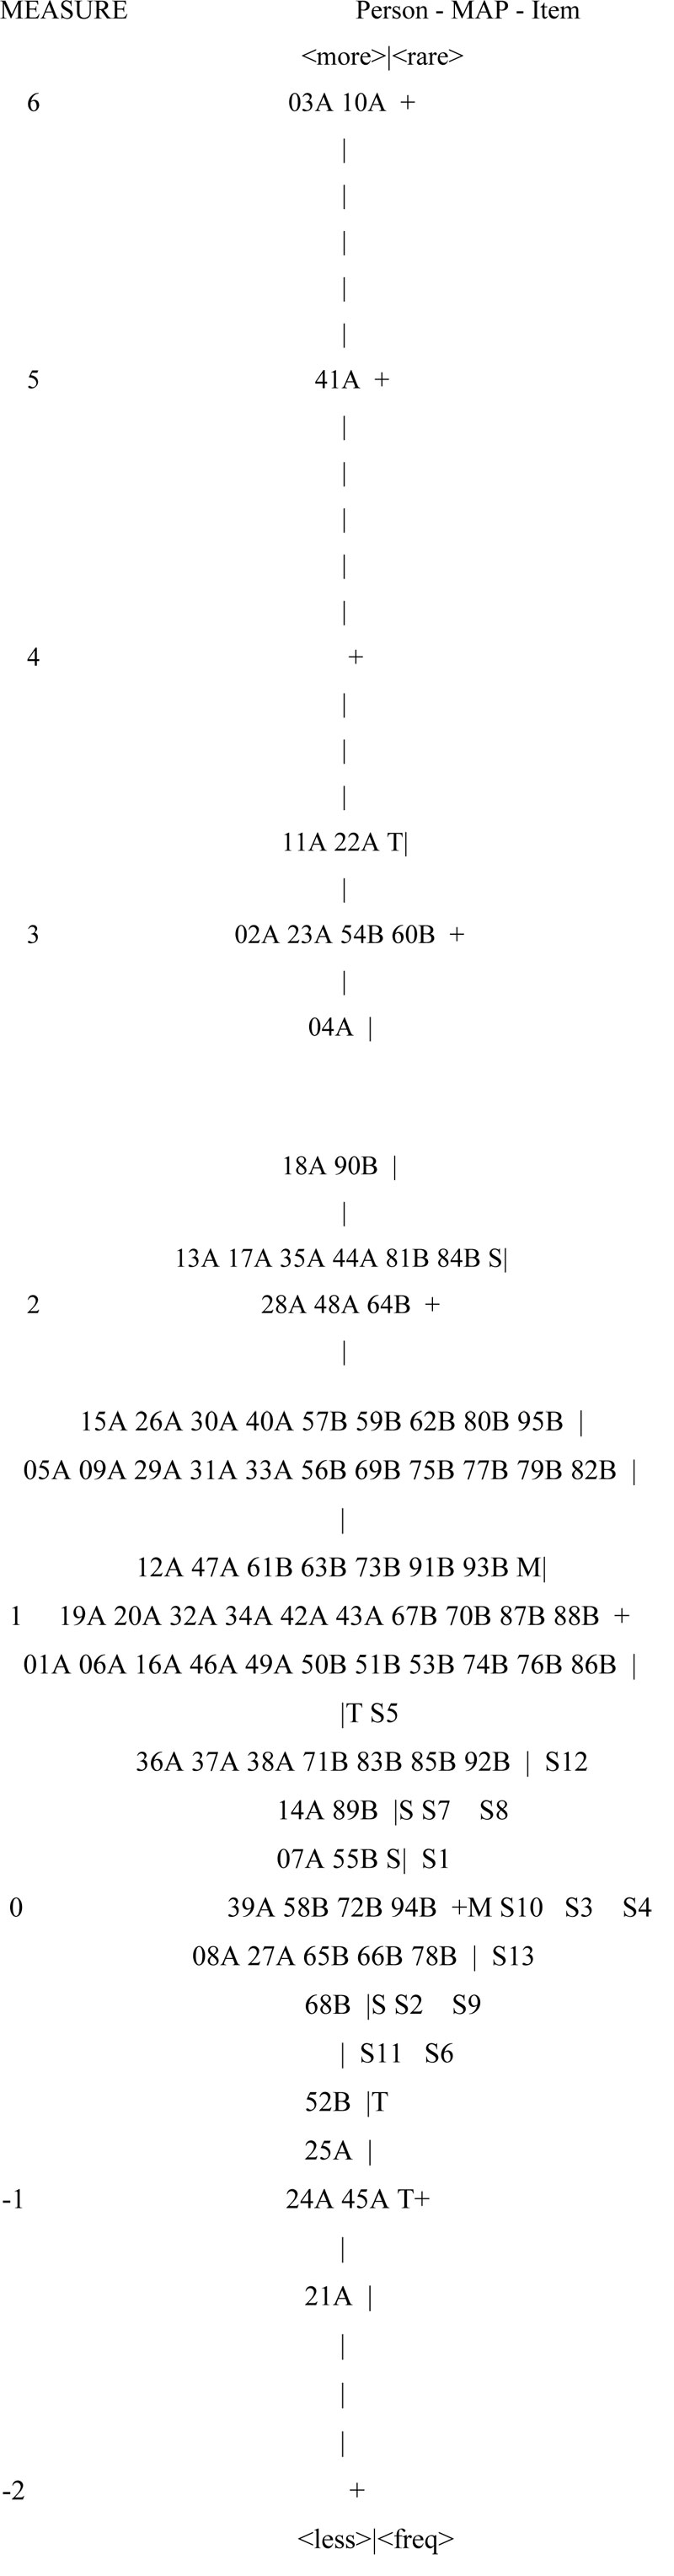
It is known that the fifth-grade student's ability to map spreads in the range of -2 to 6 logits. Their ability positions were mostly between 0SD and +2SD. The average logit of fifth-grade elementary school student's ability was +1.28, which was above the average logit item of 0.00. This means that the average fifth-grade elementary school student's ability was above the average standard difficulty level items. Meanwhile, the item difficulty level map spread in the range of 0 to 6 logits. The position of the difficulty level of 8 items was between 0SD and +1SD. The average difficulty level of standard items was below the level of fifth-grade elementary school student's ability. Thus, these confidence instrument items were easily approved by fifth-grade elementary school students.
3.3. The validity of Respondents and Items
The criteria for checking person fit or person incompatibility (outlier or misfit) According to a study [17] the criteria for checking person fit or outlier or misfit are as follows: (1) MNSQ OUTFIT value is higher than 0.5 and smaller than 1.5 and the better value is closer to one; (2) OUTFIT ZSTD value is higher than -2.0 and smaller than +2.0, and the better value is closer to zero; (3) PT MEASURE CORR values are more than 0.4 and less than 0.85. An item can be considered as fit if it meets at least one of the three criteria.
Based on the criteria according to another study [17], then the individual suitability level of 73 students in primary schools was stated as fit in the sense of providing a suitable answer by student's ability level. On the other hand, 22 students were provided an unsuitable answer with their ability level.
The results of data analysis showed that based on the first criteria, it is known that number three was the misfit item which had an MNSQ OUTFIT value of 1.57. According to the second standard, number three and nine were the misfit items which had a ZSTD OUTFIT value of 3.14 and -2.71, respectively. While based on the third criteria, it is known that 13 items have a PT MEASURE CORR values of more than 0.4 and less than 0.85.
Referring to an opinion [17], there were no misfit items. Thus, those 13 items of elementary school students were declared fit in the sense of functioning normally and can be understood appropriately by elementary school students and can measure the confidence measurement.
3.4. Item Measure
To find out the data about the level of difficulty of the items used item measure analysis, can be seen in Table 4.
From Table 4, it is known that the SD value was 0.36. if this SD value combined with the average logit value, the difficulty of the items level can be grouped into very difficult category (greater +1 SD), hard category (0.0 logit + 1 SD), easy category (0.0 logit - 1 SD), and very easy category (less than -1 SD). Thus, the limit value for the very difficult category is more than 0.36, the hard category is 0.00 to 0.36, the easy category is -0.36 to less than 0.00, and the very easy category is less than -0.36. By looking at the logit value of each item on Output Table 3 of the Measure column, sequentially based on the difficulty level (from the most difficult items to the easiest) items number five and twelve were categorized as very difficult. Items number eight, seven, one, and three were in difficult category, items number four, ten, thirteen, and twelve were categorized as easy. While items number nine, eleven and six were in the easiest category.
| ENTRY NUMBER | TOTAL SCORE | TOTAL COUNT | MEASURE | MODEL S.E. | INFIT | OUTFIT | PT MEASURE CORR | AL EXP. | EXACT OBS% | MATCH EXP% | Item | ||
|---|---|---|---|---|---|---|---|---|---|---|---|---|---|
| MNSQ | ZSTD | MNSQ | ZSTD | ||||||||||
| 3 | 287 | 95 | .08 | .18 | 1.56 | 3.12 | 1.57 | 3.14 | A .45 | .53 | 55.9 | 63.4 | P3 |
| 7 | 281 | 95 | .26 | .17 | 1.14 | .89 | 1.16 | 1.03 | B .54 | .54 | 61.3 | 62.4 | P7 |
| 11 | 305 | 95 | -.50 | .18 | 1.16 | .108 | 1.12 | .80 | C .53 | .50 | 59.1 | 63.1 | P11 |
| 13 | 295 | 95 | -.17 | .18 | 1.15 | 1.00 | 1.13 | .83 | D .59 | .52 | 55.9 | 63.5 | P13 |
| 5 | 266 | 95 | .69 | .17 | 1.13 | .87 | 1.11 | .74 | E .46 | .56 | 61.3 | 60.1 | P5 |
| 12 | 275 | 95 | .44 | .17 | 1.10 | .65 | 1.12 | .80 | F .59 | .55 | 61.3 | 61.5 | P12 |
| 10 | 292 | 95 | -.08 | .18 | 1.08 | .57 | 1.09 | .63 | G .47 | .52 | 67.7 | 63.5 | P10 |
| 1 | 282 | 95 | .23 | .17 | .85 | -.98 | .89 | -.69 | f .54 | .54 | 64.5 | 62.5 | P1 |
| 6 | 306 | 95 | -.54 | .19 | .87 | -.86 | .88 | -.76 | e .57 | .50 | 66.7 | 63.1 | P6 |
| 8 | 279 | 95 | .32 | .17 | .82 | -1.16 | .84 | -1.05 | d .52 | .54 | 69.9 | 61.8 | P8 |
| 2 | 298 | 95 | .32 | .18 | .78 | -1.46 | .79 | -1.38 | c .52 | .51 | 67.7 | 63.3 | P2 |
| 4 | 292 | 95 | -.08 | .18 | .73 | -1.90 | .73 | -1.81 | b .51 | .52 | 68.8 | 63.5 | P4 |
| 9 | 302 | 95 | -.40 | .18 | .61 | -2.89 | .63 | -2.71 | a .62 | .50 | 73.1 | 63.4 | P9 |
| MEAN 289.2 95.0 .00 .18 P.SD 11.7 .0 .36 .01 |
1.00 -.1 .24 1.6 |
1.01 .0 .24 1.5 |
- | 64.1 62.7 5.2 1.0 |
- | ||||||||
| ENTRY NUMBER | TOTAL SCORE | TOTAL COUNT | MEASURE | MODEL S.E. | INFIT | OUTFIT | PT MEASURE CORR | AL EXP. | EXACT OBS% | MATCH EXP% | Item | ||
|---|---|---|---|---|---|---|---|---|---|---|---|---|---|
| MNSQ | ZSTD | MNSQ | ZSTD | ||||||||||
| 5 | 266 | 95 | .69 | .17 | 1.13 | .87 | 1.11 | .74 | .46 | .56 | 61.3 | 60.1 | P5 |
| 12 | 275 | 95 | .44 | .17 | 1.10 | .65 | 1.12 | .80 | .59 | .55 | 61.3 | 61.5 | P12 |
| 8 | 279 | 95 | .32 | .17 | .82 | -1.16 | .84 | -1.05 | .52 | .54 | 69.9 | 61.8 | P8 |
| 7 | 281 | 95 | .26 | .17 | 1.14 | .89 | 1.16 | 1.03 | .54 | .54 | 61.3 | 62.4 | P7 |
| 1 | 282 | 95 | .23 | .17 | .85 | -.98 | .89 | -.69 | .54 | .54 | 64.5 | 62.5 | P1 |
| 3 | 287 | 95 | .08 | .18 | 1.56 | 3.12 | 1.57 | 3.14 | .45 | .53 | 55.9 | 63.4 | P3 |
| 4 | 292 | 95 | -.08 | .18 | .73 | -1.90 | .73 | -1.81 | .51 | .52 | 68.8 | 63.5 | P4 |
| 10 | 292 | 95 | -.08 | .18 | 1.08 | .57 | 1.09 | .63 | .47 | .52 | 67.7 | 63.5 | P10 |
| 13 | 295 | 95 | -.17 | .18 | 1.15 | 1.00 | 1.13 | .83 | .59 | .52 | 55.9 | 63.5 | P13 |
| 2 | 298 | 95 | -.27 | .18 | .78 | -1.46 | .79 | -1.38 | .52 | .51 | 67.7 | 63.3 | P2 |
| 9 | 302 | 95 | -.40 | .18 | .61 | -2.89 | .63 | -2.71 | .62 | .50 | 73.1 | 63.4 | P9 |
| 11 | 305 | 95 | -.50 | .18 | 1.16 | 1.08 | 1.12 | .80 | .53 | .50 | 59.1 | 63.1 | P11 |
| 6 | 306 | 95 | -.54 | .19 | .87 | -.86 | .88 | -.76 | .57 | .50 | 66.7 | 63.1 | P6 |
3.5. Respondents' Ability
Individual ability analysis functions to determine the ability of the participants by combining the Standard Deviation (SD) value and the average logit value.
SD values were 1.28. This SD value when combined with an average logit (mean) value of 1.27 means that student's ability in primary school can be grouped into several categories as follow: high ability (higher than 2.55), average ability (between -0.01 and 2.55), and low ability (less than -0.01). Thus, the logit value limit for the high ability category was more than 2.55, the average ability category started from -0.01 to 2.55, and the low ability category was less than -0.01. By looking at the logit value, of 95 participants, there were ten high ability students, there were 70 average ability students and 15 low ability students.
3.6. Detect Bias on Items
Detection of gender bias items analysis function to find out whether the items contain bias or not. This analysis used Output Table 3: Item DIF. An item statement is categorized as bias if it is more beneficial for one individual who has certain characteristics compared to different characteristics of individuals. Furthermore, an item statement is categorized as bias if the item probability value is below 0.05, which can be seen in Table 5.
The results of the bias analysis based on genders revealed that there were only two bias items, item number 3 (p = 0.0058) and item number 11 (p = 0.0035). Item number eleven and number three were easier to be answered by male students. Thus, despite giving an advantage for male students, it tended to give a disadvantage for female students.
3.7. Unidimensionality
Unidimensionality analysis identified how many attributes or dimensions measured by the instrument. This analysis used
Output Table Dimensionality by observing the value of Raw variance explained by measures and Unexplained variance in 1st to 5th contrast. Unidimensionality of measurement can be proven if Raw variance explained by measures ≥ 20% (Note: general criteria for interpretation are: sufficient 20-40%, good 40-60%, and very good above 60%) and if each Unexplained variance in 1st to 5st contrast of residuals are <15%, can be seen in Table 6.
| Person CLASSES | SUMMARY DIF CHI-SQUARED | DF | PROB. | BETWEEN-CLASS/GROUP UNWTD | Item Number | Name | |
|---|---|---|---|---|---|---|---|
| MNSQ | ZSTD | ||||||
| 2 | .0468 | 1 | .8287 | .0475 | -.88 | 1 | P1 |
| 2 | .7596 | 1 | .3835 | .7722 | .30 | 2 | P2 |
| 2 | 7.6253 | 1 | .0058 | 8.0458 | 2.60 | 3 | P3 |
| 2 | 1.5274 | 1 | .2165 | 1.5572 | .81 | 4 | P4 |
| 2 | .3533 | 1 | .5522 | .3573 | -.14 | 5 | P5 |
| 2 | .0156 | 1 | .9006 | .0158 | -1.12 | 6 | P6 |
| 2 | .0000 | 1 | 1.0000 | .0024 | -1.37 | 7 | P7 |
| 2 | .1579 | 1 | .6911 | .1607 | -.50 | 8 | P8 |
| 2 | .0510 | 1 | .8214 | .0517 | -.86 | 9 | P9 |
| 2 | .2831 | 1 | .5947 | .2861 | -.25 | 10 | P10 |
| 2 | 8.5231 | 1 | .0035 | 9.0565 | 2.77 | 11 | P11 |
| 2 | .0710 | 1 | .7899 | .0722 | -.77 | 12 | P12 |
| 2 | .0000 | 1 | 1.0000 | .0003 | -1.51 | 13 | P13 |
| Table of STANDARDIZED RESIDUAL variance in Eigenvalue units = Item information units | |||
|---|---|---|---|
| - | Eigenvalue | Observed | Expected |
| Total raw variance in observations | 18.3740 | 100.0% | 100.0% |
| Raw variance explained by measures | 5.3740 | 29.2% | 29.5% |
| Raw variance explained by persons | 2.6540 | 14.4% | 14.6% |
| Raw Variance explained by items | 2.7200 | 14.8% | 15.0% |
| Raw unexplained variance (total) | 13.0000 | 70.8% 100.0% | 70.5% |
| Unexplained variance in 1st contrast | 2.0364 | 11.1% | 15.7% |
| Unexplained variance in 2nd contrast | 1.8534 | 10.1% | 14.3% |
| Unexplained variance in 3rd contrast | 1.4275 | 7.8% | 11.0% |
| Unexplained variance in 4th contrast | 1.2466 | 6.8% | 9.6% |
| Unexplained variance in 5th contrast | 1.1147 | 6.1% | 8.6% |
| SUMMARY OF CATEGORY STRUCTURE. Model=”R” | |||||||||
|---|---|---|---|---|---|---|---|---|---|
| CATEGORY LABEL | SCORE | OBSERVED COUNT | % | OBSVD AVRGE | SAMPLE EXPECT | INFIT MNSQ | OUTFIT MNSQ | ANDRICH THRESHOLD | CATEGORY MEASURE |
| 1 | 1 | 31 | 3 | .16 | -.43 | 1.37 | 1.56 | NONE | (-3.14) |
| 2 | 2 | 188 | 15 | .13* | .31 | .86 | .84 | -1.87 | -1.27 |
| 3 | 3 | 711 | 58 | 1.13 | 1.11 | .86 | .89 | -.62 | .99 |
| 4 | 4 | 305 | 25 | 2.06 | 2.05 | 1.03 | 1.00 | 2.48 | (3.62) |
The results of data analysis showed that the raw variance explained by measures was 29.2%, this result can be categorized as sufficient. Whereas the Unexplained variance in the 1st to 5th contrast of residuals were 11.1%, 10.1%, 7.8%, 6.8%, and 6.1%, respectively. It can be seen that each of them was less than 15%. Thus, the construct of the instrument used truly measured one variable, which is student's confidence in elementary school.
3.8. Rating Scale Diagnostic
Diagnostic rating scale analysis functions to find out and verify the choice of answers in terms of confusing for participants or not. In this instrument, the choice of answers was a scale of 1, 2, 3, and 4. The answer difference was understood by the respondent through the observed average and Andrich threshold values on Output Table 3: Rating Scale showed the conformity and were equally increased in alternative answers, as can be seen in Table 7.
The results of data analysis showed that observed average and Andrich threshold values showed conformity and were equally increased in alternative answers one, three, and four while alternative answers two were causing the confusion among respondents. The analysis results showed that there was a lack of appropriateness in increasing value in both cases along with an increase in the rating scale. Thus, it can be stated that the differences in the answers choice number one, three, and four can be understood by participants, while they cannot understand the answer choice number two. Therefore, it is suggested that a sufficient amount of alternative answers is three.
4. DISCUSSION
Based on the results of the analysis with Rasch modeling, it is known that the item student's confidence in poetry learning gives consistent results, as evidenced by measuring one variable (unidimensionality), namely student confidence. In this instrument, there are no items that are declared misfit. Thus, all of the items declared fit in the sense of functioning normally and can be understood by students in grade V in elementary school and can measure what must be measured, in this case, is confidence. The student's confidence instrument contains statements related to activities involving student confidence in school, including activity, courage, social relations, responsibility, and self-actualization. This, in line with the opinion [8, 16] that the five activities will form an individual who has high self-confidence. So this instrument can be used to measure the effect of student's confidence in poetry learning.
According to a few studies [18-20], self-confidence in an individual is interpreted as someone who has confidence in himself and his abilities, potential, and all aspects that he has, and that confidence will make him feel able to achieve various goals in his life. Belief in one's abilities will affect one's level of achievement or performance [21]. Therefore, students who have confidence in themselves will be able to complete their tasks so that they can achieve various goals in their lives. We can see from the validity of the results of data analysis, it is known that the average ability of students is above the average level of difficulty of standard items. Thus, these confident instrument items are easily understood and approved by grade 5 elementary school students.
Of the 13 items analyzed, all items fit the model. The items are included in the excellent category. These data are obtained from the Cronbach Alpha value. This Cronbach Alpha value is a measure of reliability in the form of interactions between respondents and items as a whole. The results of the Cronbach Alpha reliability coefficient of 0.81 indicate that the fifth grade student's confidence scale in poetry learning has excellent reliability coefficients. That is, this instrument is in accordance with student responses, in other words students understand the contents of the instrument so that students work on the instrument properly.
Furthermore, the reliability coefficient of student's confidence items is in the sufficient category which is equal to 0.74, this means the quality of items in the instrument is quite good. The same is the case with person reliability, including the adequate category that is equal to 0.73. This shows that the respondents, in this case, students simply answer in earnest.
Based on the results of the analysis, there are 2 items that are categorized as very difficult, namely item number 5 (I dare to display poems that I made in the school wall magazine) and 12 (I became a representative of my class and/or school to take part in poetry writing and reading competitions). There are 4 items in the difficult category, namely number 8 (I am involved in group by giving input and/or ideas), 7 (I am easy to adjust to when making group in poetry learning even with friends who are not so close to me), 1 (I read poems that I made in front of the class), and 3 (I dare to ask questions to the teacher about the poetry material that I have not understood). There are 4 items in the easy category, namely number 4 (I dare to express my opinion if the teacher asks my opinion about poetry material), 10 (I try to stay focused to listen to the teacher's explanation even though poetry learning does not interest me), 13 (I get the best poetry grade in class), and 2 (I answer questions from the teacher about the purpose of the poem I made). Then, the very easy category have 3 items, namely number 9 (I do poetry assignments given by the teacher in a timely manner), 11 (I do poetry assignments as well as possible and without seeing the work of my friends), and 6 (I respect opinions or input from my friends when making poems in groups). From these results, aspects of students’ confidence that have been seen are in terms of social relationships and responsibilities, while the aspects of courage, activeness, and self-actualization, most of the students do not have it.
Difficult points for students are items number 5, 12, 8, 7, 1, and 3. Student confidence in poetry learning that is the most difficult to have is the confidence to display poetry in school wall magazines, representing the class for poetry reading and writing competitions, involved in making group poetry, adjusting when making group poetry, reading poetry in front of the class, and asking questions related to poetry material not yet understood from the teacher.However, students have confidence in terms of answering and giving opinions about poetry when the teacher asks, still listening to the teacher even though not interested in learning poetry, getting the best poetry grades, doing poetry assignments in a timely manner, doing assignments well without looking at friends' work, and respect the opinions of friends when making group poetry. This is found in items number 4, 10, 13, 2, 9, 11, and 6.
According to a study [22], students who do not display high confidence will certainly have an impact on academic achievement in school. Whereas, students who are more confident in one cognitive task tend to be more confident in other tasks [18]. Therefore, student confidence can affect student's abilities and willingness to do a task. This is in line with the opinion [23-25] that self-confidence is the courage needed by someone to convince themselves about the abilities, competencies, qualities, values, and targets they have and all of them can influence the task to be accomplished.
To see the choice of instrument answers can be seen from Table 7, the results of the student's choice of confident instrument answers namely scale 1, 3 and 4 are not confusing for respondents, while the choice of answers 2 is less understood by respondents. Thus, alternative answers are suggested not four but only three.
Based on the results of the analysis, there are items that contain bias, namely item number 3 (p = 0.0058) with the statement “I dare to ask questions to the teacher about the poetry material that I have not understood” and item number 11 (p = 0.0035) with the statement “I do poetry assignments as well as possible and without seeing the work of my friends”. Item number 3 and 11 are easier for male students to work on so that they benefit male students and tend to disadvantage female students. So numbers 3 and 11 are more male than female students. Thus, gender differences have an effect on poetry learning occurring during elementary school age.
Regarding the suitability of respondents with items, as many as 73 students have declared fit in the sense of giving answers according to their level of ability, while 22 other students gave answers that were less appropriate to their level of ability. Viewed from 95 people, as many as 10 people included in the category of high ability, 70 people in the category of moderate ability, and 15 people in the category of low ability.
CONCLUSION
Student confidence affects the learning of poetry. This can be seen from 95 participants, there are 10 people who are in the category of high ability, 70 people in the category of moderate ability, and 15 people in the category of low ability.
Based on data analysis, the results of the reliability of the instrument on the item of 0.74 included in the category enough, with a Cronbach Alpha value achieved of 0.81, which indicates that the instrument is in accordance with student responses, in other words, students understand the contents of the instrument, so students work on the instrument well. However, there are 2 items that do not meet the standard criteria as a measurement tool, namely number 3 and 11 bias genders are more beneficial for male students. Thus, these items of student confidence instruments are easily approved by students in grade V SDN Cibeureum and SDN Kotabaru.
The results of data analysis of instruments that have been analyzed or developed show that this development instrument is valid and actually measures the effect of students ' confidence in poetry learning so that it can be used to measure student's confidence in poetry learning but only uses rating scale, unidimensionality, person measure, item measure, item fit order, person fit order, person-item-map, and summary statistics. So it can be concluded that the Rasch model can be used to analyze the results of the instrument.
ETHICS APPROVAL AND CONSENT TO PARTICIPATE
Not applicable.
HUMAN AND ANIMAL RIGHTS
Not applicable.
CONSENT FOR PUBLICATION
All participants participated voluntarily and gave their informed consent.
AVAILABILITY OF DATA AND MATERIALS
The data shall be shared on request to the corresponding author [D.S] upon reasonable request.
FUNDING
None.
CONFLICT OF INTEREST
The authors declare no conflicts of interest, financial or otherwise.
ACKNOWLEDGEMENTS
The gratitude goes to the Learning Evaluation course for providing the opportunity to create this article.