All published articles of this journal are available on ScienceDirect.

Psychological Diversity in the Workplace: Personality Types and Gender Differences within Ethnicities
Abstract
Introduction:
In recent years, the process of hiring an employee has become an important part. New and innovative ways of assessing employees are continuously sought after, primarily to ensure the right person for the right job. Exploring under-studied psychological differences which may impact the workplace could shed light on this important topic.
Methodology:
In this research, personality test results from 119 participants from Egypt, India, Lebanon and Philippines, men and women working in the Food & Beverage industry in Kuwait were collected. Each participant was given the Myers-Briggs Type Indicator (MBTI) personality type questionnaire which identifies individuals into one of 16 personality types.
Results:
Each ethnicity cluster was tested individually for frequencies and correlations of specific personality types within their own groups, as well as an investigation on the possibility of gender correlations. It was found that the proportions of the personality types are the same among genders across both their ethnicity group as well as their personality type.
Conclusion:
The findings are significant in that they shed the light on hidden psychological elements which may have an impact on the workplace. They may also aid communication strategies amongst different ethnicities as well as give insight on motivational factors which may lead to more productivity.
1. INTRODUCTION
In recent years, the process of hiring an employee has become an important part of the overall value creation process [1-3]. Without a doubt, new ways of assessing employees are continuously sought after, primarily to ensure the right person for the right job [4, 5]. Online questionnaires are a dime a dozen; however, they help assess a wide range of aspects. Psychologists have long emphasized that determining one’s personality traits using these questionnaires can help determine how well they do in a given task [6, 7]. Based on these recommendations, many personality-type questionnaires have been developed, some with little to no credibility [8-10]. One of the most notable works, and the basis of the majority of questionnaires related to human behavior and psychology, is that of the psychologist Geert Hofstede [11]. In his work, he was able to classify cultural groups into clusters of ‘types’. Building on his theories and experiments on dimensions of culture, perhaps there emerged a scientific way of answering questions like why do one type of ethnicity do better at a certain job or task than another [12, 13]. Hofstede’s work is the inspiration behind this research, where the aim is to investigate possible correlations between ethnicity and personality type. Hofstede’s work confirmed that people in different nations astoundingly had similar results when questioned about values [14]. Thus, he succeeded in dissecting the results and clustering them into groups of ‘nations’ and then placing these nations into one of the four quadrants he developed of ‘perceived values’. His empirical findings prove that national differences are evident in the way people think about values [15-17].
In the 1960’s, Geert Hofstede created a structure designed to enable cross-cultural communications, known as Hofstede’s Cultural Dimensions Theory [18, 19]. Essentially, by employing a factor analysis framework, it explores how the culture of a society can impact the values and behaviours of the people within it [20]. Many academics in a variety of disciplines have utilised Hofstede’s theory for research purposes, however, it is most extensively employed in cross-cultural psychology, international management, and cross-cultural communications [21-24]. In 1991, Michael Harris Bond et al. carried out research on students from 23 various nations, employing a survey tool developed with Chinese managers and staff [25]. As a result of this study, Hofstede felt the need to include Confucian dynamism, better known as long term orientation (LTO) as a fifth element.
2. MATERIALS AND METHODS
2.1. Dimensions of National Cultures
Initially, the theory comprised of five distinct facets for evaluating cultural values. Due to this work by Minkov, Hofstede was convinced to add a sixth and final dimension to the framework, which is indulgence versus restraint.
- Power Distance Index (PDI): “Power distance is the extent to which the less powerful members of organizations and institutions (like the family) accept and expect that power is distributed unequally”. Some societies display high power distance, and it is recognised that there is a hierarchy which does not need to be rationalised. Others exhibit a low power distance, and in this case, attempt even power distribution [26]. Cultures embracing a lower power distance are usually more democratic in nature.
- Individualism (IDV) vs. Collectivism: “The degree to which individuals are integrated into groups”. In societies with high degrees of individualism, personal accomplishments and individual rights are emphasised. Individuals are expected to support themselves and their families, and to make individual decisions regarding associations and relationships [27]. Conversely, in societies with high degrees of collectivism, group thinking and group behaviours are prevalent. It has been stressed that “the word collectivism in this sense has no political meaning; it refers to the group, not to the state”. The population tends to be comprised of large extended families, which strike a bargain for protection and loyalty.
- Uncertainty AvoidanceIndex (UAI): “a society's tolerance for uncertainty and ambiguity”. Essentially, this is a measure of how the members of a society try to manage anxiety by minimising uncertainty. Typically, a high uncertainty avoidance culturally equates to a more emotional population. They implement rules, laws, and regulations, in addition to meticulous planning in an attempt to minimise uncertainty. Conversely, a society with a low uncertainty avoidance has a culture of acceptance and ease in ambiguous circumstances. Additionally, they tend not to have many rules [28]. Generally, the population is well equipped to cope with change, and is more practical.
- Masculinity (MAS) vs. Femininity: In a society which is culturally masculine, emphasis is placed on competitiveness, assertiveness, materialism, ambition, and power. Conversely, a society which has a culture of femininity is more concerned with living standards and relationships [29]. Furthermore, in feminine culture, there is typically a gender balance in relation to values of humility and compassion for their fellow members, whereas in masculine cultures, there is a greater gap between the genders.
- Long-term Orientation (LTO) vs. Short-term Orientation: This category analyzes the time orientation of societies and how they perceive it. Long-term oriented societies attach more importance to the future, whereas in short-term oriented societies, values usually include steadiness, respect for tradition, preservation of one's face, reciprocation and fulfilling social obligations.
- Indulgence vs. Restraint (IVR): This dimension measures the extent to which members of society tend to control their desires and impulses. While indulgent societies have a tendency to allow relatively free gratification of basic and natural human desires related to enjoying life and having fun, restrained societies have a conviction that such gratification needs to be curbed and regulated by strict norms [30].
2.2. Cultural Variances
The six-dimension’s model, developed by Hofstede, enables international contrasts between different cultures to be examined by rating the country from 1 to 120. This is also referred to as comparative research. The power distance index displays elevated results for Latin, Asian and African countries, as well as Arab nations. At the same time, Anglo and Germanic countries show a low score using this index (Austria – 11, Denmark – 18). Using Hofstede’s model, it can be seen that the United States, with a score of 40, sits between Guatemala’s high power distance (95) and Israel’s very low score (13). The power distance of European countries varies according to geographic location, with high scores in southern and eastern areas, and low scores in northern countries; for instance, Sweden (31), the United Kingdom (35), Poland (68) and Spain (57).
The individualism index highlights a distinct difference between developed, Western countries and less developed, Eastern countries. While North American and European countries can be regarded as largely individualistic, displaying high scores such as 80 for both Hungary and Canada, this cannot be said for Asian, African and Latin American countries. These exhibit clear collectivist beliefs, showing low scores, such as Colombia (13) and Indonesia (14). The degree of contrast that exists can be seen through an examination of two countries at opposing ends of the spectrum, with Guatemala scoring 6 and United States scoring 91. Japan and Arab countries fall in the middle of this range. Southern and Eastern Europe, not excluding German-speaking countries, Japan and Latin America display the highest levels of uncertainty avoidance. The opposite is true for Anglo, Nordic and culturally Chinese countries. Vast differences can occur regardless of geographic location, which is highlighted through the scores for Germany (65) and Belgium (94), in comparison to Sweden (29) and Denmark (23). Very few countries, however, display an extremely low UAI.
The Nordic countries display low levels of masculinity, i.e., Norway (8) and Sweden (5), while this is much higher in Japan (95) and certain European countries, predominantly those influenced by German culture, such as Hungary, Austria, and Switzerland. Anglo countries score quite highly in this area with the United Kingdom achieving 66. Latin America returns opposing scores from within the region; for instance, Venezuela has a high 73 compared to Chile’s low 28. Regarding long-term orientation, the highest scores are returned by East Asia, for example, China (118), Hong Kong (96) and Japan (88). Eastern and Western Europe generally deliver medium scores while Anglo, Muslim, African and Latin American countries largely display the lowest scores, although there is much less information covering this dimension. Similarly, there is very little data available covering the sixth dimension, indulgence. What is known is the highest scores are shown in Latin American, Anglo and Nordic countries, and certain areas of Africa, while East Asia, Eastern Europe and Muslim countries show much lower levels [31].
2.3. Associations between Values
In order for successful cross-cultural communication to take place, it is necessary to have a good grasp of the cultural influences, since what is the norm in one country may be considered distasteful in another [32, 33]. This applies to communication at all levels: verbal (the words and language used), non-verbal (body language and gestures), and customs (clothing, gift-giving, dining, etc.). The dimensions in Hofstede’s model provide recommendations to companies to build procedures that are culturally appropriate, which are expected in turn to increase employee satisfaction and ultimately impact productivity [34, 35]. As well, culture is rather complex and plays an important role in the various aspects of an individual’s life. It also impacts an individual’s way of understanding and communicating, as well as how they behave both in their professional and personal life. A lack of understanding of these dynamic issues has led to a lot of managerial issues for businesses [36-39]. The culture in any country holds the key to success in the workplace and has an effect on the overall bottom line [40-42].
2.4. Significance of Research
This research is significant in that it sheds light on psychological aspects in the workplace and how ethnicities, which are built upon social norms and values, can be impactful [43-45]. Moreover, although there is an abundance of research on the matter of applied psychology in the workplace as mentioned above, yet there is a dearth of studies that investigate possible correlations of ethnicity and workplace behavior [46-48]. In their recent research, Diab-Bahman [30] found a possible correlation between ethnicities and personality types. From this and other studies mentioned above, it is expected that social conditioning and cultural dimensions are the pillars of behavior and, when clustered by ethnicity, commonalities are rather obvious to discover [49, 50]. Precisely from the Middle East, where a large number of workers migrate daily for work purposes, studies that dig into the cultural dimensions will prove to be beneficial for people in understanding and communicating with one another in the workplace [51].
2.5. Personality Tests
Several personality surveys are now available either for free or for purchase on the internet [52-60]. The one chosen for this paper was the Myers-Briggs Type Indicator (MBTI) due to its user-friendly interface and ease of reading the outcomes. The MBTI is a psychometric test, in the form of a questionnaire, which is typically used to understand the psychological predilections associated with the way individuals view the world and undertake the decision-making process [61-63]. Based on Carl Jung’s Psychological Types, created during World War II by Isabel Myers and Katherine Briggs, this 16-type indicator test makes use of a number of factors [64]. The questionnaire consists of 64 5-degree Linkert style forced-answer binary (yes/no) questions [65, 66]. This type of subjective approach enables psychology researchers to examine a variety of psychological characteristics and to group them into different cultural clusters [67-69].
In this paper, the findings related to personality types from the Myer-Briggs test are evaluated for correlations within each ethnicity and gender. This may be an important realization for numerous reasons, as this can be a step towards the right direction in determining the right person for the right job. The aim of this study was to test correlations between employees of similar ethnicities and their individual personality types. Further, it aimed at examining the relationship between personality traits within the same ethnic group and gender. Finally, the paper presents a recap of the findings and how further studies could be possible.
2.6. Materials and Methodology
The study is quantitative in nature. It involves an exploratory research design and the relationships among the statistical personality tests were used to find the association between the MBTI personality, gender and ethnicity. Analysis was conducted with the help of SPSS to test the hypothesis of the study.
2.7. Sample
The study sample comprised 120 employees working in six different companies; as the study was exploratory in nature, the participants were randomly selected, with a total of 20 employees sampled from a group of companies contacted in the F&B world. The number of employees chosen from each company was minimal as the research was meant to simply explore the subject at hand on a macro level. Purposeful sampling was used to choose the companies as they were selected based upon the personal contacts available at the time of this research. Each of the companies was asked to provide a list of available employees and their nationalities prior to an arranged meeting to engage them in this research. Initially, 120 subjects have been recruited from 6 companies affiliated with the Kuwait’s Food and Beverage industry. One employee withdrew after the results were obtained, bringing down the total to 119 participants. The participants, recruited on voluntary basis, varied in backgrounds, gender, age and education level. Raw data were used to generate descriptive analysis and draw conclusions to the initiatives of the research questions. The test was administered online in English. The study spanned a 2-month period due to timing and scheduling, as the researchers had to be present while the test was being administered in order to document the results. The employees were ensured regarding privacy and confidentiality of the information provided by them.
2.8. Tools and Administration of Questionnaire
This exploratory research followed a deductive reasoning approach as hypothesis testing was conducted after the collection of data. Cross-sectional study design was undertaken for carrying out a macro-level scan of the topic of interest. The primary tool for this research was a questionnaire; each participant was given the Myers-Briggs Type Indicator (MBTI) personality type computer-based questionnaire to fill. The four-letter personality score was provided immediately after the questionnaire was completed. . The questionnaire consisted of 64 forced-answer 5-degree Linkert style questions, which is accessible to be used for free online [70-72]. The reason for choosing the mentioned survey is that it was easy to administer and use by the employees chosen.
3. RESULTS AND DISCUSSION
3.1. Major Findings
3.1.1. Personality Types within Ethnic Groups
The differences are best shown in the descriptive bar charts presented in Fig. (1), which show the personality types observed in each ethnicity.

- Egyptians are primarily (42%) Introverted/Sensing/ Thinking/Perceiving (ISTP) and secondarily Extraverted/ iNtuitive/Feeling/Judging (ENFJ) accounting for 25%. Other types are ENTP and ISTJ with equal proportions. This ethnicity had the lowest number of personality types (four).
- Indians are represented by six types. The most frequent is the Introverted/Sen sing/Thinking/Judging (ISTJ), with an occurrence of 52% (the maximum percentage observed in all ethnicities). The other types appear much lower, the Extraverted/iNtuitive/Feeling/ Perceiving (ENFP) with 19%, the Introverted/Sensing /Thinking/Perceiving (ISTP) with 14%, and ENFJ, ESTP and INTP even lower, less than 5% each.
- Similar discrepancies are observed in Lebanese who involve 8 types. Lebanese are most frequently Extraverted/Sensing/Thinking/Perceiving (ESTP) (46%). The Extraverted/iNtuitive/Feeling/Perceiving (ENFP) type is observed in 14%, while Extraverted/iNtuitive/Thinking/Judging (ENTJ) appears in 11%. Other types with low occurrences are ENTP, ESTJ, INTP, INTJ, and ISTP.
- The most types (nine) are seen in Filipinos, where the Extraverted/iNtuitive/Feeling/Perceiving (ENFP) has the maximum occurrence in 31%, followed by the Introverted/Sensing/Thinking/Perceiving (ISTP) in 19%; after that, comes the Extraverted/Sensing/Think ing/Judging (ESTJ) and Extraverted/Sens ing/Thinking/Perceiving (ESTP), each with 12%. Other types include ENFJ, ENTP, INTJ, INTP and ISTJ.
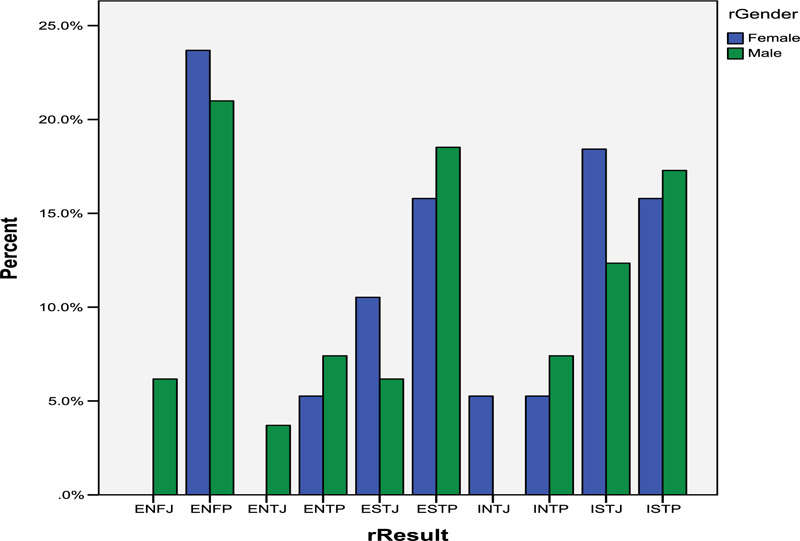
3.2. Differences between Genders
The next analysis involved the comparison between genders in the whole sample, regardless of ethnicity. Fig. (2) shows some differences (e.g., in ENFJ where five out of five are men; similarly, in ENTJ with three out of three being men, and in INTJ with two out of two women), but these are based on small counts.
To see if there is an association of gender with personality type, a chi-square test was used as it can be used to find relationships between the two variables being studied. In this case, a Chi-square could serve the purpose of this research as it is a non-parametric test that is used to show an association between two qualitative variables, such as personality and gender. The test was used to determine the following:
▪ H0: the distribution of personality types is the same between genders.
The alternative hypothesis:
▪ HA: the distribution of personality types is not the same between genders.
The results showed no significant effect of gender on the personality type (X2(9) =9.9, p = .36), therefore, we cannot reject the null hypothesis. The small differences mentioned indeed did not play a role.
3.3. Differences between Genders within Ethnicities
Finally, we repeated the procedure for the comparison between genders, but this time within each nationality (Egyptians, Indians, Lebanese, Filipinos) separately; thus, four hypotheses have been generated.
▪ H0: The distribution of personality types is uniform in an ethnicity.
The alternative hypothesis:
▪ HA: The distribution of personality types is not uniform in an ethnicity.
The results (Table 1) do not show any significant association in any ethnicity. Thus, it was concluded that there is no significant effect of gender on the personality type in either ethnicity, and we cannot reject the corresponding four null hypotheses.
| Chi-Square Testsa | ||||||
| Monte Carlo Sig (2-sided) | ||||||
| Asymptotic Significance (2-sided) | 99% Confidence Interval | |||||
| Value | df | Significance | Lower Bound | Upper Bound | ||
| Pearson Chi-Square | 5.887b | 7 | 0.553 | 0.665c | 0.653 | 0.677 |
| Likelihood Ratio | 8.085 | 7 | 0.325 | 0.64c | 0.628 | 0.652 |
| Fisher's Exact Test | 5.741 | 0.683c | 0.671 | 0.695 | ||
| N of Valid Cases | 28 | |||||
b. 8 cells (100.0%) have expected count less than 5. The minimum expected is .33.
c. Based on 10000 sampled tables with starting seed 1335104164.
| Chi-Square Testsa | ||||||
| Monte Carlo Sig (2-sided) | ||||||
| Asymptotic Significance (2-sided) | 99% Confidence Interval | |||||
| Value | df | Significance | Lower Bound | Upper Bound | ||
| Pearson Chi-Square | 7.531b | 8 | 0.481 | 0.514c | 0.501 | 0.572 |
| Likelihood Ratio | 8.993 | 8 | 0.343 | 0.509c | 0.497 | 0.522 |
| Fisher's Exact Test | 6.562 | 0.617c | 0.604 | 0.629 | ||
| N of Valid Cases | 58 | |||||
b. 8 cells (100.0%) have expected count less than 5. The minimum expected is .33.
c. Based on 10000 sampled tables with starting seed 1335104164.
3.4. Analysis
From the findings above, the following can be concluded:
- As for the first question, it was clear that the null hypothesis (H0) that the distribution of personality types is uniform in an ethnicity was rejected for all four ethnicities. The findings showed Egyptians as primarily (42%) while Indians predominantly (52%) ISTJ, and Lebanese most frequently ESTPs (46%); also, Filipinos showed to be 32% ENFP.
- In the second question that tested whether there were any differences between the genders when considering the proportions of the personality types, the differences observed were too small; hence, the hypothesis could not be rejected.
- Finally, when testing the null hypothesis (H0) that the distribution of personality types is uniform in an ethnicity, it was found that the 4 hypotheses were rejected as the gender differences amongst the four different ethnicities were rather small.
4. LIMITATIONS OF THE STUDY
In this research, there was only one method used to collect information. To achieve an overall better view, it is recommended to employ subjective, objective, and projective methods when possible (Blinkhorn et al., 1988). Any future research on the matter could also benefit from incorporating both qualitative and quantitative methods to gain a broader perspective on the matter. The questionnaire administered has been established between the 1940s and 1960s (myersbriggs.org, 2016). Perhaps, a more up-to-date questionnaire could yield more optimal results. Moreover,the number of participants was small, and if increased, it could provide a more comprehensive idea of the subject matter and a more generalized view of the findings. Another limitation could have been resulted in terms of language barrier.
Since the employees were all second-language speakers of English, it could be possible that they did not understand some of the questions. This could also have caused some effect on the results. Finally, though conventional demographical data was collected, such as age, gender, and educational level, only gender was tested for an impact on ethnicity. Perhaps, in future research, more extensive correlations between the mentioned elements could be made. This could be beneficial as it could further reveal more hidden aspects of the perplexity of diversities in the workplace.
CONCLUSION
In this study, we investigated the effects of ethnicity on the personality types of the Yung theory, as this was extended and improved by Briggs-Myers. We collected the test results of 119 individuals from four ethnicities (Egyptians, Indians, Lebanese and Filipinos), and conducted statistical tests on several hypotheses. We found significant variations within each ethnicity. On the contrary, gender was not significant, overall or within ethnicities, perhaps contrary to common belief.
IMPLICATIONS OF RESEARCH
This research is necessary in that it adds to the already-existing wealth of applied psychology in the workplace as it sheds the light on the complex factors, which can come into play when exploring the notion of hiring the right person for the right job. The findings are important in that they give a clear indication that there are, in fact, significant relationships between the psychological diversities in the workplace and cultural diversity, both of which have an impact on employee’s overall wellbeing and ultimately their satisfaction and productivity. Therefore, it is important to note these outcomes and take them into consideration when dealing within a multicultural environment. Policymakers and those interested in identifying best practice among groups of various diversities can surely benefit from the findings, as they can help form and align human resources policies and procedures to ensure a win-win situation for both the institute and the employee.
FUTURE PERSPECTIVE
In this paper, the findings of Geert Hofstede and the questionnaire developed by Jung and Myers-Briggs constituted the basis of the thought process and hypothesis. Due to the success in finding a correlation in a small number of the population, a further study with more subjects could reveal more accurate results.
Lastly, it would be interesting to suggest further analyses with more controlling factors, for example, socio-economic status of parents, educational levels, years of professional experience, as well as the ones addressed here. There seems to be a dearth of information on such ethnic matters and how they impact the workplace; thus, it would be wise to consider them in a multitude of ways in the future research.
ETHICS APPROVAL AND CONSENT TO PARTICIPATE
The local Ethics board, which is part of the ministry of health, was consulted prior to the study, and they decided that this research did not need an ethics approval as nothing was physically administered.
HUMAN AND ANIMAL RIGHTS
No animals were used in this research. All human research procedures followed were in accordance with the ethical standards of the committee responsible for human experimentation (institutional and national), and with the Helsinki Declaration of 1975, as revised in 2013.
CONSENT FOR PUBLICATION
All patients participated on a voluntary basis and gave their informed consent.
AVAILABILITY OF DATA AND MATERIALS
The author confirms that the data supporting the findings of this study are available within the article.
FUNDING
None.
CONFLICT OF INTEREST
The author declares no conflict of interest, financial or otherwise.
ACKNOWLEDGEMENTS
Declared none.