All published articles of this journal are available on ScienceDirect.

Study on the Threats of Reverse-Worded Items to the Psychometric Properties of the Marital Quality Scale
Authors Info & Affiliations
Abstract
Background:
The reverse-worded or negative items are often intended to reduce bias when responding to a measurement scale, but it impacts the psychometric properties of measuring instruments. The study aimed to describe the effect of the positive and negative items on the psychometric properties of the marital quality scale and to overcome the problems with a multidimensional analysis.
Methods:
Three hundred thirty-seven married people (166 men and 171 women, age = 35 years) were involved in the research. The confirmatory factor analysis (CFA) and coefficient reliability were conducted to answer the purpose of the study.
Results:
The results showed that the loading factor of the reverse-worded items was higher when it was analyzed separately than in the mixed model. The one-dimensional model provided lower a fit measurement model and reliability estimates than the two and four-dimensional models. Confirmatory factor analysis and composite reliability by separating positive dan negative items could be an alternative analysis to resolve the problem of psychometric properties in measuring instruments with combined items.
Conclusion:
An analysis by separating the positive and negative items was a strategy to reduce the threat to the validity and reliability of the instrument.
1. INTRODUCTION
A measurement scale is widely used to measure opinions, attitudes, and beliefs because it is considered a practical method for taking and analyzing research data [1]. However, the instrument tends to be vulnerable to individual tendencies to respond to the items according to social desirability [2-5]. Social desirability is a person's tendency to give positive self-description [6]. A measurement instrument with high social desirability allows for bias in responding to the actual situation [7]. One strategy to overcome this problem is adding reverse-worded items to the measurement instrument [8].
The statement items are usually constructed in line with the research purpose, called positive items. A reverse-worded item is a statement opposite to what will be revealed [4]. These items were developed with negative statements made for the same purpose of measurement. Therefore, it is also called a negative item. The more a respondent agrees with a statement, the more positive response and the fewer with a negative statement. An example of a positive item on the marital quality scale is “I like to share my experiences with my partner.” The reverse-worded is “In many things, I do not want to tell my partner about my activities.” These items are made in the same dimension with positive and negative statements so that there are variations in the attribute of a measurement instrument.
Some researchers create statements with both positive and negative items. The intent of the item words, either positively or negatively, on the same scale is usually to avoid approval bias. It prevents biased responses or the respondent's tendency to agree with the item, regardless of its content [9], or to make the subjects’ responses less likely to lead to one answer pattern [10]. Reverse-worded items can encourage the subjects to read all items carefully [11]. Another advantage is changing the thinking patterns or ways of responding, so the subjects will react to varied items. These items in a measurement instrument are expected to make the subjects' responses more appropriate, precise, honest, and less biased [12]. Thus, the reverse-worded items aim to increase the instrument's validity by increasing the subjects' beliefs to provide answers with a broader range of reasons and ways of thinking [9]. However, the reverse-worded items sometimes confuse the respondent due to difficulty understanding the item statements [13, 14].
The measurement of psychological attributes makes the subjects possible to respond dishonestly because the items contain social desirability [15, 16]. The previous studies showed that most of the Javanese marital quality score was high, and only a few were low. The measurement results on the subjects also didn’t show the normal distribution and tended to have a positive skewness [17]. The high marital quality is possible because the measuring instrument has items with the same response, positive worded or favorably, so it is easy to respond dishonestly. Dishonesty in responding can result in biased answers that decrease the accuracy of the results and the practical relevance or recommendations of the research findings [18]. The study developed a measuring instrument by replacing some previous survey items with reverse-worded items. It aimed to reduce bias towards the agreement response [8, 9]. Unfortunately, this method often causes poor psychometric characteristics such as internal consistency, reliability, and validity [4, 9].
Several studies on the property of measurement instruments showed the effect of the same response pattern that combined positive and negative items on property psychometrics. The studies found an increase in coefficient reliability when reverse-worded items were eliminated [11]. Meanwhile, lower internal consistency was found in the instrument with combined items [19]. The use of reverse-worded items made the subjects inconsistent in responding to them, resulting in poor internal consistency reliability [11]. The reverse-worded items also made the measuring instrument have a lower model fit index if made into a one-factor model. Another common issue was that the items clustered into one different factor even though they measured the same aspect or dimension [4, 12, 20-22].
One of the strategies to overcome this problem is analyzing the psychometric properties based on multidimensionality [22-25], so the measuring instruments that are originally one-dimensional are treated as multidimensional. Reverse-worded items in one dimension allow them to separate and cluster with other sizes. Thus, a two-factor analysis is suggested by analyzing the items separately and not being mixed with the items on the favorable dimension even though it conceptually measures the same components.
1.1. Objective
The study objective was to investigate the effect of reverse-worded items on the marital quality scale psychometric properties. The analysis was carried out one-dimensionality or mixed the items with positive and negative responses, and multidimensional by separating both items' categories. The study was expected to explain the effect of combined items of the measurement instrument on the property psychometrics, including the results of factor analysis, getting the suitability of the data from the marital quality scale to the measuring model, and finding out the reliability coefficient of the marital quality. The results become the alternative to the research procedure to achieve a more appropriate psychometric property of the measurement instrument with positive and negative items.
2. MATERIALS AND METHODS
2.1. Participants
The study participants were 337 married people (male=166 and female=171) living in Yogyakarta, Indonesia. The average age of the participants was 35 years, while the youngest was 19 years, and the oldest was 63 years. In terms of educational background, there were 6 primary-education graduates, 112 secondary-education graduates, and 219 college graduates.
2.2. Procedure
This research was conducted in July 2021. Due to the ongoing Covid-19 pandemic situation, the research data were obtained by an online instrument via Google Form. The data collection was conducted by offering the participants to subject per the research criteria. The criteria for the respondent of this research were husbands or wives living in Yogyakarta city. The study was conducted voluntarily, depending on the willingness of the subjects to participate. All the participants had agreed to participate in the study and had declared their agreement in the informed consent.
2.3. Instrument
The research instrument was the marital quality scale improved from the previous studies [17, 26, 27]. The marital quality scale was on a Likert scale with four categories of responses. The scale was developed from the dimensions of husband-wife relations and well-being. The previous instrument developed the same pattern of items. Yet, in this study, several items were changed with the reverse-worded items, and several items with the same meaning were deleted. Therefore, the final draft consisted of 51 out of 57 items. The number of positive items was 16, and the negative was 8 on the relation dimension, 6 positive, and 6 negatives on the well-being. The specifications of the marital quality scale are presented in Table 1.
| Dimensions | Indicators | Item Number | |
| Relationship | Communication | 1, 2, 3 | |
| Understanding | 4, 5, 6 | ||
| Trust | 7, 8, 9 | ||
| Love | 10, 11, 12 | ||
| Complete | 13, 14, 15 | ||
| Keeping together | 16, 17, 18 | ||
| Maintaining sexual relationship | 19, 20, 21 | ||
| Respect | 22, 23, 24 | ||
| Support | 25, 26, 27 | ||
| Acceptance | 28, 29, 30 | ||
| Well-being | Role sharing | 31, 32, 33, 34, 35, 36 | |
| Solving family problems together | 37, 38, 39 | ||
| Family problems solved | 40, 41, 42, 43 | ||
| Feeling calm | 44, 45 | ||
| Feeling comfortable | 46, 47 | ||
| Feeling grateful for the marital state | 48, 49 | ||
| Feeling happy in marriage | 50, 51 | ||
2.4. Data Analysis
The effect of items reverse-worded on psychometric properties of the marital quality scale was analyzed from the construct validity and estimated the reliability. The analysis was carried out by examining the suitability of the marital quality measurement model by confirmatory factor analysis (CFA) and estimating the reliability of the marital quality scale by the Cronbach's alpha, stratified alpha, and omega reliability formulas. CFA was used to determine the most suitable measurement model for the marital quality scale and the maximum loading factor for the items. The reliability was estimated with many models to find the highest reliability from the analysis.
The identification of the fit index to test the accuracy of the measurement model was carried out by using the chi-square statistical reference along with the degrees of freedom and significance values, RMSEA (root mean square error approximation), SRMR (standardized root mean square residual), CFI (comparative fit index), and PNFI (parsimony normed fit index). Except for chi-square, these indices were found to be the least sensitive to the sample size of the model specification error and parameter estimation [27]. The criteria for the model fit index were the insignificant chi-square (χ2) index (>0.05), while RMSEA was lower than 0.08 [27]. SRMR was lower than 0.10 [28], and CFI was more than 0.95 [28], whereas PNFI was higher than 0.90 [29]. The magnitude of the factor loading for each item was used to determine the psychometric properties of each item and compare the T value of each item with a minimum criterion of 1.96. The reliability coefficient analysis was carried out by using Cronbach’s alpha formula. It was analyzed using a one-factor or unidimensional model, while the alpha coefficients for stratified-parallel tests were used to estimate the reliability of the multidimensional model [30].
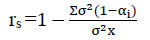 |
(1) |
rs = reliability coefficient for stratified-parallel
σ2i= varian dimention i
αi = reliability coefficient dimention i
σ2x = total varians x
The omega formula from McDonald's [30, 31]was appropriate to estimate the reliability based on confirmatory factor analysis as the study used CFA in its construct analysis. The omega formula is used to estimate the reliability of the study.
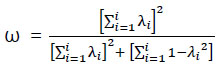 |
(2) |
 = reliability coefficient of omega formula
3. RESULTS
3.1. Descriptive Analysis
The overview of means, standard deviations, and correlation between dimensions of the research data are described in Table 2. The data were described from all items (T), dimension relation (R), and well-being (WB). It was known that the means of positive items on the dimension relation (R+) had higher than negative items (R-), but the standard deviation was lower. The same phenomenon was also found in positive items of well-being (WB+) dan all of the positive items (T+). The correlation between dimensions showed a higher coefficient correlation on the positive with positive items than the correlation between the positive with negative in the same dimensions. The overall data, relation, and well-being correlation did not consistently show a higher coefficient correlation positive than the negative dimensions.
| Mean | SD | R- | R | WB+ | WB- | WB | T+ | T- | T | |
| R+ | 3.612 | 0.468 | 0.752 | 0.919 | 0.743 | 0.702 | 0.764 | 0.921 | 0.778 | 0.887 |
| R- | 3.414 | 0.595 | 0.951 | 0.551 | 0.74 | 0.694 | 0.688 | 0.924 | 0.862 | |
| R | 3.513 | 0.498 | 0.679 | 0.772 | 0.774 | 0.844 | 0.917 | 0.932 | ||
| WB+ | 3.48 | 0.558 | 0.778 | 0.931 | 0.945 | 0.72 | 0.865 | |||
| WB- | 3.438 | 0.673 | 0.953 | 0.796 | 0.941 | 0.923 | ||||
| WB | 3.459 | 0.581 | 0.915 | 0.891 | 0.951 | |||||
| T+ | 3.546 | 0.479 | 0.799 | 0.937 | ||||||
| T- | 3.426 | 0.591 | 0.959 | |||||||
| T | 3.486 | 0.508 |
3.2. Factor Analysis
The examination of psychometric characteristics began with confirmatory factor analysis (CFA). The one-dimensional model analyzed the positive and negative items simultaneously or unidimensional. In the two-dimensional model, the positive and negative items were analyzed separately, the first dimension included the positive items, and the second dimension included the negative items. The other study of the two-dimension model was separated from relation and well-being items. The model four-dimension was analyzed by separately the positive and negative items on the quality of marital relations and marital well-being. The most suitable measurement model for the marital quality scale was explored from these models using the various suitability indices of the test accuracy of the measurement model.
The four measurement models were analyzed by the maximum likelihood of the structural equation model (SEM). It was found that the four-dimensional model was the best (Table 3), and it had a better fit than the two and one-dimensional models. The two-dimensional model had a better fit than the one-dimensional model. Based on the comparison of the index score and cut score, all models had suitability based on all the referenced suitability criteria, except for chi-square, which stated that all measurement models did not fit. However, considering the dimension model, the positive and negative items were separated.
3.3. Reliability Analysis
The reliability estimation was carried out by analyzing the reliability of Cronbach alpha, stratified alpha and omega reliability formulas. The formula was utilized to estimate the reliability of the unidimensional and multidimensional models. The reliability analysis results on each dimension are shown in Table 4. The reliability of the unidimensional model (α= 0.972,
=0.937) provided a lower reliability estimation than the two with separating positive and negative (α= 0.974 &
=0.943) and four-dimensional models (α= 0.976
= 0.948) on all items. Thus, it can be concluded that there was an increase in the reliability of the separated items of positive and negative compared to the combined items, both on all items of relation and well-being and each dimension. These results were also in line with the standard error measurement that decreased if the positive and negative items were separated
| Measurement Models | Chi-square/df and p-value (<3 and >0.05)) | RMSEA (<0.08) | SRMR (<0.2) | CFI (>0.95) |
PNFI (>0.9) |
| Unidimensional (All Item) | 4.865 (0.000) | 0.110 | 0.067 | 0.96 | 0.90 |
| 2-Dimensional (R&WB) | 4.126 (0.000) | 0.096 | 0.062 | 0.96 | 0.91 |
| 2-Dimensional (T+&T-) | 3.896 (0.000) | 0.093 | 0.059 | 0.96 | 0.91 |
| 4-Dimensional (R+, R-, WB+, WB-) | 2.903 (0.000) | 0.075 | 0.051 | 0.97 | 0.91 |
| Patterns | N | r (α) | SEM | r (
) |
SEM |
| Unidimensional (All items) | 51 | 0.972 | 0.085 | 0.937 | 0.128 |
| 2-Factor (R & WB) | 51 | 0.973 | 0.083 | 0.942 | 0.122 |
| 2-Factor (T+ & T-) | 51 | 0.974 | 0.082 | 0943 | 0.121 |
| 4-Factor (R+, R-, WB+, WB-) | 51 | 0.976 | 0.079 | 0.948 | 0.116 |
| R (2-Factor: R+ & R-) | 39 | 0.969 | 0.088 | 0.918 | 0.143 |
| W (2-Factor= W+ & W-) | 12 | 0.921 | 0.163 | 0.842 | 0.231 |
| T+ (2-Factor: R+ & WB+) | 32 | 0.963 | 0.092 | 0.893 | 0.157 |
| T- (2-Factor: R- & WB-) | 19 | 0.938 | 0.147 | 0.899 | 0.188 |
| R+ | 26 | 0.961 | 0.092 | 0.874 | 0.166 |
| R- | 13 | 0.915 | 0.173 | 0.861 | 0.222 |
| WB+ | 6 | 0.826 | 0.233 | 0.802 | 0.248 |
| WB- | 6 | 0.885 | 0.228 | 0.952 | 0.147 |
4. DISCUSSION
The results of the descriptive analysis in Table 2. showed that the mean score of the positive items was higher than the negative. Even so, the variance of these items' scores was not parallel. The negative items made the score of the measurement results more varied than the positive. Variations in scores impacted the variation in the subjects' responses due to the language patterns of different statements. The difference in response patterns was due to the difference in the statements of positive and negative items affecting the subjects' perception and the given attitude response [12, 31]. The perceptions of the subjects' beliefs influenced their positive and negative response to items. The perception was related to the subjects' beliefs that influenced their positive and negative response to items [32, 33]. Positive statements lead to positive perceptions. The statement items guide respondents to respond more easily in answering questions or choosing responses that suit themselves. In contrast to negative statements, respondents will think it is more difficult to give answer choices. As a result, the response to positive items is higher or easier than the negative ones. In addition, the variation on negative items is higher because of the higher difficulty level, which confuses choosing answers. The results of this study strengthen the statement that positive words are more frequently used than negative on the response of the measurement instrument [35].
The factor analysis is the method clustered the items based on the similarity of data characteristics. Items measuring the same dimension are clustered together on one dimension. The research found the negative items could be analyzed in the same dimension. Suppose the dimensions in the instrument have positive and negative items. In that case, they will produce two factors from the result of factor analysis, so it is often interpreted that the negative items indicate a problem with the psychometric property of the measuring instruments, especially in construct validity [9, 12, 35]. These results align with the research showing that the negative items resulted in the incompatibility of this research model with the theoretical framework, or the model became unfit [36, 38]. The negative sentences produced a different factor structure if the same response was added to the measuring instrument [39]. It is the reason that made the results of the fit coefficient of the model with the overall data lower than the separated analysis.
The reverse-worded items produced a new dimension. The dimensions of the measuring instrument that is originally unidimensional will become multidimensional if it composes of the combined items. Thus, the strategy to analyze the measuring instruments that are originally unidimensional to multidimensional can be an alternative to avoid the threat to the poor fit model in combined items. The results of the CFA in this study proved that the research constructs were fitter if they analyzed multidimensionally or separated between positive and negative than combined items. Thus, the two-factor model was fitter than the one-factor model, and the four-factor model was more fit than the other models.
Estimation coefficient reliability was carried out with several formulas. Alpha was familiar; two of alpha's procedures were used in this research. These were used because the tested measurement model had a different number of dimensions. If unidimensional is treated as multidimensional, it will have consequences on the lack of clarity in interpretation, theoretical complexity, and poor factors, so it cannot be replicated substantively. Consequently, it is impossible to obtain accurate individual measurement results [40]. On the other hand, treating multidimensionality as unidimensional can lead to biased parameter estimates, e.g., too high loading and underestimating error [41]. Therefore, a reliability estimation was carried out in the unidimensional model using Cronbach's alpha formula. Meanwhile, in the multidimensional model, a reliability estimate was performed using the Alpha coefficients for stratified-parallel tests and omega from the loading factor and the result of CFA.
The study found that the four-dimensional model had the highest reliability coefficient compared to the one and two-dimensional models. It means that the reliable measurement of the measuring instrument by applying a multidimensional model with the parallel tests gives higher reliability estimation results than the unidimensional reliability estimations. Since the inclusion, the modifications in alpha coefficients, such as the alpha coefficients for stratified-parallel tests, may provide better reliability than alpha coefficients based on individual items [42]. When the positive and negative items were combined on the same measuring scale, it had consequences on the threat to test dimensionality by secondary variance sources [5]. The negative items had lower total-item correlations than the positive items. This is why the reliability estimation results with the unidimensional reliability were poorer [9, 42]. The findings in this study are also supported by the multidimensional omega reliability of the McDonald formula [31]. Ultimately, it can be concluded that unidimensional analysis for multidimensional underestimates the reliability consistently [43-46].
Increased coefficient reliability will decrease in SEM. The study also shows that the increased reliability of the data analyzed separately decreases the measurement error. This means the accuracy is high; separating positive and negative items in different dimensions will produce more precise and accurate measurement results. These results are also in line with the results of the loading factor for each item (see Appendix 1). The reverse-worded items will perform a higher loading in the two and four-factor or separated model than in the one-factor or unidimensional model.
The addition of a new dimension to the constructed instrument, which was originally unidimensional, indicated a change in the construct of the measuring instrument. The separation of positive and negative items on the same construct could be interpreted into two opposite dimensions, but they could complement each other. In this study, the construct of marital quality was originally one-dimensional and was changed to the quality of marriage with dimensions of quality and was not quality. The four-factor model can be changed to relationship, incompatible, well-being, and unhappy family. Separating these components will also enrich the meaning and reporting of marital quality measurement results in several dimensions or components.
This study indicated that a measurement scale with combined items had a fewer fit model and internal consistency when analyzed unidimensional. The psychometric problems in terms of reliability due to the reverse-worded items on a measurement scale imply that it is better not to use combined positive and negative items because of creating a threat to the validity and reliability of the instrument. However, if the combination is necessary, it is advisable to separate the positive and negative items in analyses of the psychometric properties, especially in estimating reliability and factor analysis.
CONCLUSION
Combining the reverse-worded items of the marital quality scale resulted in lower psychometric properties. An analysis by separating these items was a strategy to reduce the construct validity and reliability coefficient threat. This procedure can be an alternative to solve the poor psychometric properties of the measuring instruments with positive and negative items. The limitation of the study is the analysis of two and four dimensions of positive and negative, with enough items in each dimension. The study cannot facilitate the analysis with more than four dimensions, and the number of positive and negative items on each dimension varies. Further research is needed to strengthen the results of this study by analyzing mixed data with more dimensions and variations in the number of items in each dimension or the other simulation with several conditions to be inference on the other situations.
ETHICS APPROVAL AND CONSENT TO PARTICIPATE
The health research ethics committee, Universitas ‘Aisyiah Yogyakarta, has approved the participants' research procedures. The number of ethical approval: 1855/KEP-UNISA/VII/2021.
HUMAN AND ANIMAL RIGHTS
No animals were used for studies that are the basis of this research. All the humans used were according and the Helsinki Declaration of 1975.
CONSENT FOR PUBLICATION
The participants stated their agreement to participate in this research by filling out the informed consent form.
STANDARDS OF REPORTING
STROBE guidelines were followed.
AVAILABILITY OF SUPPORTING DATA
All data generated or analysed during this study are included in this published article.
FUNDING
This research was funded by Direktorat Jenderal Pendidikan Tinggi, Kementerian Pendidikan dan Kebudayaan, and Riset, dan Teknologi, Indonesia (grand number 046/F4.1/AK.04.PT/2021).
CONFLICT OF INTEREST
The author declares no conflict of interest, financial or otherwise.
ACKNOWLEDGEMENTS
Declared none.
| Items | Statements | 1-factor | 2-factor (R & WB) |
2-factor T+ &T- | 4-factor R+R-Wb+Wb- |
| 1 | I like to share my experiences with my partner. | 0.43 | 0.43 | 0.43 | 0.44 |
| 2 | My partner used to tell me about his/her experience. | 0.4 | 0.41 | 0.42 | 0.42 |
| 3 | In many things, I do not want to tell my partner about my activities. | 0.43 | 0.42 | 0.48 | 0.47 |
| 4 | I understand my partner’s nature. | 0.44 | 0.44 | 0.45 | 0.45 |
| 5 | I feel understood by my partner. | 0.43 | 0.43 | 0.44 | 0.44 |
| 6 | I do not know how to please my partner. | 0.43 | 0.43 | 0.47 | 0.48 |
| 7 | I believe that my partner is loyal. | 0.44 | 0.45 | 0.45 | 0.46 |
| 8 | I feel trusted by my partner. | 0.41 | 0.42 | 0.43 | 0.43 |
| 9 | I often doubt my partner’s abilities | 0.48 | 0.47 | 0.53 | 0.53 |
| 10 | I love my partner. | 0.34 | 0.34 | 0.33 | 0.34 |
| 11 | I feel loved by my partner | 0.4 | 0.49 | 0.41 | 0.41 |
| 12 | Honestly, I do not love my partner anymore. | 0.38 | 0.39 | 0.42 | 0.43 |
| 13 | I need my partner. | 0.35 | 0.36 | 0.36 | 0.37 |
| 14 | I feel needed by my partner. | 0.46 | 0.46 | 0.46 | 0.46 |
| 15 | I often feel unneeded by my partner. | 0.54 | 0.54 | 0.58 | 0.6 |
| 16 | My partner and I used to have a conversation. | 0.52 | 0.53 | 0.53 | 0.53 |
| 17 | My partner and I used to eat together. | 0.49 | 0.49 | 0.49 | 0.49 |
| 18 | I prefer to go alone than to go with my partner. | 0.59 | 0.59 | 0.64 | 0.64 |
| 19 | I enjoy making out with my partner. | 0.43 | 0.43 | 0.43 | 0.43 |
| 20 | I see my partner enjoy making out. | 0.42 | 0.42 | 0.43 | 0.43 |
| 21 | I am not able to meet my partner’s sexual needs. | 0.51 | 0.51 | 0.62 | 0.64 |
| 22 | To make important decisions, I always ask my partner’s opinion | 0.51 | 0.51 | 0.53 | 0.52 |
| 23 | My partner asks for my opinion on the decision he/she will make. | 0.53 | 0.54 | 0.54 | 0.54 |
| 24 | It is better to tell a story to a friend than to a partner who cannot help solve problems in the family. | 0.58 | 0.58 | 0.63 | 0.64 |
| 25 | I used to encourage my partner when he/she fails. | 0.47 | 0.47 | 0.48 | 0.48 |
| 26 | My partner cheers me up when I am down. | 0.5 | 0.51 | 0.51 | 0.52 |
| 27 | My partner is less supportive towards my activities. | 0.48 | 0.48 | 0.54 | 0.56 |
| 28 | I can accept my partner’s flaws. | 0.38 | 0.38 | 0.38 | 0.38 |
| 29 | I feel accepted by my partner. | 0.48 | 0.49 | 0.49 | 0.49 |
| 30 | My partner often demands something that I do not have. | 0.51 | 0.52 | 0.57 | 0.59 |
| 31 | I share household tasks with my partner. | 0.49 | 0.5 | 0.5 | 0.5 |
| 32 | My partner and I share responsibilities in the family. | 0.45 | 0.46 | 0.47 | 0.47 |
| 33 | If my partner is absent, I do not need to do his/her household tasks because they are his/her responsibilities. | 0.52 | 0.52 | 0.57 | 0.6 |
| 34 | Even though we have a lot of things to do, my partner and I always complete our respective tasks. | 0.46 | 0.46 | 0.47 | 0.47 |
| 35 | Even though it is a hassle, my partner and I try to carry out our respective responsibilities. | 0.42 | 0.42 | 0.43 | 0.43 |
| 36 | My partner often does not care about his/her responsibilities in the family. | 0.54 | 0.55 | 0.58 | 0.6 |
| 37 | When there is a problem in the family, I discuss it with my partner. | 0.49 | 0.5 | 0.5 | 0.5 |
| 38 | When there is a problem in the family, I solve it with my partner. | 0.49 | 0.49 | 0.5 | 0.5 |
| 39 | When there is a problem in the family, he/she tends to solve it by him/herself. | 0.54 | 0.54 | 0.59 | 0.59 |
| 40 | My partner and I rarely have conflicts. | 0.47 | 0.5 | 0.48 | 0.52 |
| 41 | There are often problems between me and my partner. | 0.53 | 0.59 | 0.55 | 0.6 |
| 42 | So far, there is always a solution when there is a problem in the family. | 0.39 | 0.43 | 0.39 | 0.44 |
| 43 | Some of my problems in the family cannot be solved. | 0.53 | 0.57 | 0.57 | 0.59 |
| 44 | I never worry about my marriage. | 0.41 | 0.46 | 0.41 | 0.48 |
| 45 | I feel less settled in my marriage. | 0.59 | 0.67 | 0.61 | 0.68 |
| 46 | I enjoy my marriage life. | 0.48 | 0.55 | 0.48 | 0.57 |
| 47 | I have not felt comfortable in my marriage. | 0.57 | 0.67 | 0.6 | 0.68 |
| 48 | I feel that God has given many blessings to my marriage. | 0.42 | 0.47 | 0.41 | 0.48 |
| 49 | I sometimes feel that God is unfair in giving problems in my marriage. | 0.53 | 0.62 | 0.57 | 0.64 |
| 50 | In my marriage, I feel more joy than sorrow | 0.47 | 0.51 | 0.48 | 0.53 |
| 51 | I feel less happy in this marriage. | 0.56 | 0.6 | 0.58 | 0.62 |