All published articles of this journal are available on ScienceDirect.

The e-S.F.E.R.A. Questionnaire: A New Tool For Sport Psychologists Working In Mental Training
Authors Info & Affiliations
Abstract
Background:
Esports are gaining worldwide recognition. Given the characteristics of this discipline, esporters need proper mental preparation. The S.F.E.R.A. model is widely used in sport psychology practice in Italy, aiming to maximize athletes’ performance and improve five mental factors: Synchrony, Strength, Energy, Rhythm, and Activation.
Objectives:
The present study aims at 1) developing a questionnaire to detect those factors and 2) investigating their similarity with more classical psychological dimensions.
Methods:
A sample of 211 players of competitive online games filled out the “e-S.F.E.R.A. Questionnaire”. Confirmatory Factor Analysis for each factor and regressions on Engagement, Flow and Addiction were performed.
Results:
Results 1) confirm the monofactorial structures of mental factors and 2) show the positive relations of Energy with Vigor and Dedication of Engagement and Activation with all dimensions considered, including Addiction.
Conclusion:
This study provides sports psychologists with a new framework and tools for esporters’ mental optimization.
1. INTRODUCTION
Esports has become one of the largest industries in terms of value and participation. The number of spectators interested in esports is constantly increasing and has recently reached nearly half a billion globally [1]. Despite this, psychology has long been disinterested in this area, or has focused on its negative aspects, from the effects of exposure to violence to health damage due to a sedentary lifestyle [2]. This has led to a great disparity between the breadth and spread of the gaming industry, on the one hand, and the lack of scientific knowledge about it on the other [3].
In this section, we will make a quick overview of this phenomenon, investigating if and how esports can actually be considered a sports discipline in its own right, exploring the demographic characteristics of the average eplayer today and the physical and psychological effects of this activity. A theoretical and practical model for the optimization of performance will also be introduced, widely used by Italian sports psychologists with athletes of more traditional sports disciplines, and whose applicability to the field of esports will be investigated as the main objective of the present work. First of all, it is necessary to clarify the spelling of the word, as it will be used throughout the paper: following the indications of the Associated Press, the term esport seems to be the right way to refer to this kind of discipline. Therefore other similar forms (Esport, e-sport, etc.) will be left aside [4]. Accordingly, individuals competing in this field will be referred to as esporters or eplayers.
1.1. Can Esports be Considered Sports?
According to Jonasson and Thiborg [5], a sport is a regulated, competitive and physical game [6]. However, this definition has been criticized for being incomplete, given that the criteria of institutionalization [7] and social acceptance [6] were not considered.
As Parry [8] points out, athletic physical activity is not defined by a certain intensity but by whether the action affects the final result or not. This is also the criterion followed by the International Olympic Committee, and it also seems applicable to esports [8]. Institutionalization, on the other hand, is composed of the universalization of the rules and promotion of the sport itself [7]. The creation of common rules is hampered by the fact that the video games on which esports are based have extremely short life spans [9]. To compensate for this problem, esports are progressively moving from a “bottom-up” regulation, that is, from fans and members of the video game community in question to a “top-down” one, where the manufacturer of the game itself, together with its release, is also involved in the organization of its esport scene. Lastly, the social recognition of esports is being affirmed on several levels [6]: on the one hand, from the players, who started defining themselves as athletes since the first video game tournaments in the ‘80s [9]; on the other, from the spectators, whose main motivation to observe this kind of sport is linked to the high competitiveness put on the field by the athletes, similarly to traditional sports’ audiences [10]. Therefore, considering these characteristics, it seems proper to define sport as a physical, competitive, institutionalized, and socially accepted activity.
1.2. Characteristics of an Eplayer and Well-being in Esports
Eplayers can start their careers at a very young age, i.e., as early as 14-15 years old [11], and a sharp decline can already be seen from 24-25 years onwards [12]. Beyond the economic aspect, esporters differ from other people playing video games purely for fun due to the fact that they consider playing video games competitively a job, and engaging in the game differently [13]. The esports market could be considered as a superstar market, characterized by the fact that, similarly to what happens in the traditional sports and entertainment industry, players’ salary and prestige increase exponentially, and not linearly, as the players’ skills and results increase [14].
In the literature, it is highlighted that, for esporters’ careers, spending many hours a day in contact with electronic devices is linked to various physical and psychological consequences.
Physical ones can be grouped into four macro categories:
- Visual fatigue problems: e.g., Computer Vision Syndrome (Visual fatigue, low back pain, and tension headaches are the most common symptoms [15].
- Musculoskeletal problems: Caused by maintaining a sitting posture for several hours a day [16].
- Cardiovascular problems: While the sedentary life of athletes seems to negatively impact blood circulation, on the other hand, the variability of heart rate increases if one competes in esports, improving the body’s ability to adapt to different situations [2].
- Injury: Another element in common with traditional sports, in the esports field, the most common complications are related to pain in hand or wrist [15].
The consequences on mental health, instead, can be related to:
- Stress: Linked to increases in blood pressure, respiratory rate, and skin temperature [2].
- Burnout: In the context of esports, it seems to be correlated with the personality factor of agreeableness, probably given its incompatibility with the particularly aggressive and competitive environment that characterizes esports [17].
- Addiction: Characterized by three key symptoms, i.e., withdrawal, craving, and tolerance. Internet Gaming Disorder (IGD) is the only behavioral addiction, except for gambling addiction, in all of DSM-5. IGD addiction is defined as “persistent and recurring use of the internet to participate in games, often with other players, leading to clinically significant impairment or distress” (DSM-5, pp. 795-798; American Psychiatric Association, 2013), but this conceptualization has been criticized for failing to adequately distinguish between a strong passion for video games and a real addiction [18].
Shifting the focus on the positive aspects, much more related to the sport activity, eplayers can show a number of skills: the ability to interface with artificial intelligence and electronic devices; communication skills; improved cognitive abilities (such as increased visual perception of complex stimuli, better attentional resources, reduced response times, etc. and the ability to endure a long sitting position without compromising performance [11]. Furthermore, it has been observed that some eplayers habitually employ some psychological techniques during their gaming sessions in order to increase their performance [19].
A number of studies have shown that psychological training skills can lead to improved esports performance. For example, psychological skill training (PST) to improve some mental techniques such as goal setting, self-talk, mental imagery, mental rehearsal and relaxation seem to have positive effects on team cohesion and performance [20, 21] and even manuals about psychological training for esporters are also being developed [22]. More generally, it has been observed that higher psychological skills and higher self-regulation and social support are linked to better esport performance [23]. Psychological training techniques are habitually employed in traditional sports psychology, such as those focused on mental toughness and stress-coping processes, having a beneficial effect in this regard, also for esporters [24].
In light of these findings, this paper will be focused on the development of an instrument useful to sports psychologists to monitor some psychological aspects which could enhance esport performance, based on an Italian model of psychological training, already widely used in traditional sports practice, adapting it to the particular features of esports.
1.3. The S.F.E.R.A. Model
The present research is based on the “S.F.E.R.A. model”, developed by Vercelli [25, 26]. It is widely used in sports practice, adopted by the Italian National Olympic Committee (CONI), by several Olympic athletes and even by some professional clubs of various sports. According to the model, there are five mental factors to train to improve performance.
- Synchrony: The ability of being fully present in what one is doing at the moment of performance, supported by techniques such as self-talk and self-observation. It is the key to reaching all one's resources, especially the unconscious ones, and making them available to the performance. In fact, it is common for athletes who have reached this state to report that they move almost automatically, as if they were not driving their own bodies.
- Strength: To bring only and exclusively the athlete's strengths into the competition (physical, technical, and psychological skills and abilities that the athlete acknowledges possessing in an excellent way). It is linked to the concept of self-efficacy. Any defects should be temporarily forgotten. It is important to emphasize that this attitude is functional only at the moment of the game [27], while during training, athletes should work to their limits.
- Energy: The active use and regulation of strength and power, which allows athletes to best express their resources in a self-controlled way. It is further divided into Dynamism (enthusiasm and be ready to face unexpected events) and Dominance (assertiveness on opponents and influence on teammates).
- Rhythm: The orderly succession of time intervals, which generates the right flow in the sequence of movements and gives quality to the action.
- Activation: A motivational engine of an emotional and passionate nature, favored by connection with one's emotions, self-talk, and self-analysis. Activation is, more than any other factor, an internal sensation, the athletes’ belief that they are ready to perform in the match.
To achieve maximum performance, there must be a strengthening and a total balance between these five factors. Furthermore, the mind and body, conscious and unconscious, must work in unison, as if they were a unity, clearing the mind of any other thought.
Subsequently, this theory was enriched by qualitative methods of analysis and graphical visualization of the five factors, such as the S.F.E.R.A. mandala [25, 27] and quantitative methods, such as various questionnaires suited to different contexts of sport life: individual activity, group sports, training and competition, etc. [28].
Some similarities are noticeable between the theoretical descriptions of such factors and several classical constructs more common in sport psychology. For example, the pleasant dimension of Activation and the automaticity of thought and movement described in Synchrony closely resemble the dimension of Flow at Sport, and especially its subdimension of Absorption [29]. On the other hand, the focus on effort and physicality of Rhythm and Energy reminds us of the construct of Engagement, and of its Vigor subdimension in particular [30]. Thus, considering the use of the S.F.E.R.A. model applied in the esports’ field, it seems possible to find relations between Flow and Synchrony with Activation, and between Engagement and Rhythm with Energy, other than Activation again, as also the construct of Engagement includes an emotional aspect [30]. Moreover, as the five factors of S.F.E.R.A. sustain the healthy development of one's passion, a negative or absent relation with addiction is expected.
1.4. Objectives
Consequently, the present research pursues the following goals:
- To detect the five S.F.E.R.A. factors in gamers by developing the “e-S.F.E.R.A. questionnaire” and to measure its statistical properties;
- To explore the relationships of the five e-S.F.E.R.A. factors with more classical psychological dimensions implied in sport psychology, namely, Engagement, Flow at Sport and Gameaholism.
2. METHODS
2.1. Participants and Procedures
The study was conducted with a convenient sampling method, recruiting respondents by e-mail or online word of mouth, spreading the questionnaire in guilds and groups of different kinds of games. The main Italian esport scenes have been contacted: the Italian Esport Prototype Championship (Machine Simulator Tournament), the PG Nationals (Italian League of Legends Championship), the eSerie A Tim and the Italian Fortnite Championship. The final sample size was 211 people, of which 78.2% were males. Their average age was 26.5 years, and they devoted, on average, 15.32 hours to video games per week. 21.3% participate in official competitions. Shooter games and MMORPGs (massively multiplayer online role-playing games) were the most popular genres (23.8% and 20% of respondents, respectively), followed by i-racing (14.8%), MOBA (multiplayer online battle arena, chosen by 11.4% of respondents) and card games (10%). Finally, the last demographic question was dedicated to the self-perceived level of professionalism: 94 people rated themselves as casual players (44.5%), defined as someone who games just amateurly, for fun; 85 as intermediate (40.3%), occasionally participating in ranked matches; and 32 as advanced (15.2%), someone who participates in high-level competitions.
It is important to underline the discrepancy that can be seen between a self-assessment of respondents’ expertise level (only 15.2% define themselves as an advanced player) and a relative behavioral indicator (as many as 21.3% have participated in official competitions). These results show how difficult it is to clearly define who is and who is not an eplayer [31].
| Gender | Male | 78.2% |
|---|---|---|
| Female | 21.8% | |
| Age | 18-25 | 53.6% |
| 26-30 | 23.7% | |
| 31-40 | 17.5% | |
| > 40 | 5.2% | |
| Favourite game genre | Shooter | 23.8% |
| MMORPG | 20% | |
| iRacing | 14.8% | |
| MOBA | 11.4% | |
| Cards | 10% | |
| Sports | 7.1% | |
| Fighting | 3.3% | |
| Other | 9.5% | |
| Professionalism level | Casual | 44.5% |
| Intermediate | 40.3% | |
| Advanced | 15.2% | |
| Participation to official competitions | Yes | 21.3% |
| No | 78.7% |
2.2. Instruments
e-S.F.E.R.A: The focal point of the research was the development of the e-S.F.E.R.A. Questionnaire. Items were formulated by two experts (a full professor of applied psychology and an expert sport psychologist certified by the International Olympic Committee). The questionnaire was created and then administered in Italian, following previous questionnaires based on S.F.E.R.A. models related to sports performance [32], business [33] and university teaching areas [34]. Both negatively and positively worded items were formulated to avoid acquiescence or agreement bias [35]. A starting pool of 83 items (18 for Synchrony, 17 for Strengths, 15 for Energy, 16 for Rhythm, and 17 for Activation) was created. During the next step, as suggested by the procedure described by DeVellis (2016), two experts (i.e., sport psychologists who daily use the S.F.E.R.A. model in their psychological practice with athletes) were involved to evaluate if items could properly refer to each dimension they were created for, based on their knowledge and experience. A total of 23 items (6 from Synchrony, 5 from Strengths, 3 from Energy, 4 from Rhythm, and 5 from Activation) were deleted from the starting pool, following experts’ suggestions. A 12-item scale was then reachedfor each factor of the model, to capture their main aspects. Moreover, to evaluate its face validity and ensure the comprehensibility of the item formulation, a pilot administration of the questionnaire was carried out, involving some ex esporters or players of competitive video games without participating in tournaments. Some items’ formulations were adjusted following their suggestions, in order to be more understandable and transversal, i.e. usable by esporters who play different types of games; for example, the item “I moved my avatar with the right timing” was reformulated as “I moved with the right timing”, since not every game has got a single avatar to control. The 60-items version of the instrument was used for the analysis in this work.
The questionnaire requires thinking about a competitive gaming contest that the player recently participated in and responding to a series of statements related to it. The response mode is a Likert scale from 1 (Completely disagree) to 5 (Completely agree).
Flow at Sport: Flow is defined as “a state of consciousness generated while participating in an activity which enjoys and absorbs the individual, and which is intrinsically rewarding” [29]. The I-WOLFS scale evolved from the Work-Related Flow Inventory, originally developed by Bakker [36], which intends to measure Flow within work contexts. Bakker further operationalized this construct into three dimensions: Absorption, an immersive experience where all attentional resources are focused on the current task, even forgetting the passage of time or surrounding events; Work Enjoyment, defined as the subjective pleasure felt during the activity; and Intrinsic Motivation, the desire to execute a task exclusively because of the pleasure directly coming from it [29]. In 2018, Zito and colleagues [29] adapted this scale to the sports context, creating the I-WOLFS scale. Thus, Work Enjoyment has reconceptualized into Sport Enjoyment and Intrinsic Motivation became Intrinsic Sport Motivation. This scale was further modified for this study, to make it adequate to the esportive world, and the items were suitably rewarded. Also in this case, the response mode is a Likert scale, ranging from 0 (Completely disagree) to 6 (Completely agree).
2.2.1. Engagement
This dimension was adapted from the Utrecht Work Engagement Scale (UWES) [37], which intends to measure engagement at work, defined as a positive mental state of pleasure and satisfaction toward one’s job [30]. It can be divided into three dimensions: Absorption, which, similar to the previous scale’s dimension of the same name, is defined as being fully concentrated and happily engrossed in one’s work, whereby time passes quickly; Vigor, defined as the grade of effort, energy and resilience invested into the activity; and Dedication, the subjective feeling of the meaning of one’s work, generating pride and enthusiasm [30]. To adapt this instrument to the field of video gaming, the items of its Italian version [30] have been reworded, but its structure has remained almost identical. In this case, the response mode is a frequency scale ranging from 0 (never) to 6 (always).
2.2.2. Gameaholism
Workaholism is defined as a sort of addiction to work, divided into three dimensions: Work Involvement, the inability to disconnect from work and to relax; Drive, the frequency and intensity of obsessive thoughts relative to work; and Enjoyment of Work, the positive subjective experiences felt during one’s work [38]. The Gameholism scale was created for this study starting from the Workaholism Battery [38], but, differently from it doesn’t measure the three subdimensions separately. The response mode is a Likert Scale ranging from 1 (Completely disagree) to 5 (Completely agree).
2.3. Data Analysis
Analyses were performed using both SPSS 28 (IBM, Armonk, NY, USA) and Mplus 8 (Muthén & Muthén, Los Angeles, CA, USA) software. SPSS 28 was implied for: descriptive statistics, reliability (Cronbach’s ɑ), correlations, and regression. Mplus 8 was used to perform CFAs with a Maximum Likelihood method of extraction. CFA (confirmatory factor analysis) was used to test the mono-factorial structure of each S.F.E.R.A. factor; the rationale behind this choice is linked to the practical purpose of this research i.e. to provide sports psychologists with tools to be used separately during psychological sessions aimed at evaluating and optimizing a specific factor. For the sake of completeness, indices of the 5-factor model will also be presented, both for all initial items and those remaining after individual factor analyses.
Common method bias was assessed with Harman’s single factor test [39]. Significant common method variance (CMV) exists if one general factor accounts for the majority of covariance in the measures. Therefore, an exploratory factor analysis (EFA) was performed to test this eventuality. All variables in this study were included in the EFA. Analyses bore out twenty-one factors with eigenvalues greater than one accounting for 62.21% of the total variance, while the first and second factors accounted for 7.28 and 19.29% of the variance, respectively. Considering these results, not a single factor is emerging and accounting for most of the variance, showing the lack of a common method issue.
3. RESULTS
3.1. Descriptive Statistics
The factors measured by the e-S.F.E.R.A. Questionnaire showed the following mean points: 3.56 (SD = 0.70) for the Synchrony factor, 3.55 (SD = 0.67) for Strength, 3.59 (SD = 0.63) for Energy, 3.49 (SD = 0.73) for the Rhythm, and 3.26 (SD = 0.90) for the Activation.
Multivariate and univariate skewness and kurtosis of all 60 items were calculated. For multivariate skewness and kurtosis, the tool at the site https:// webpower.psychstat.org/ models/ kurtosis was used (Mardia’s multivariate kurtosis z = 24.36; p < .001); an acceptable value of Mardia’s normalized multivariate kurtosis coefficient is less than 3.0 [40]. Therefore this value shows a non-normal distribution of data. On the other hand, values below ±2.0 for skewness and ±7.0 for kurtosis, according to a more liberal standard [40], are acceptable and the condition of univariate normality. According to these cut-offs, univariate skewness and kurtosis show a normal distribution for all items except for item 4 of Activation (skewness = –2.05).
| - | Item | Mean | SD | Asymmetry | Kurtosis | ||
|---|---|---|---|---|---|---|---|
| Stats | SE | Stats | SE | ||||
| Synchrony | Sync_1 | 3.31 | .99 | .05 | .17 | –.37 | .33 |
| Sync_2 | 2.73 | 1.11 | .17 | .17 | –.83 | .33 | |
| Sync_3 | 3.65 | .90 | –.09 | .17 | –.41 | .33 | |
| Sync_4 | 3.84 | .99 | –.75 | .17 | .21 | .33 | |
| Sync_5 | 3.16 | .89 | –.12 | .17 | –.09 | .33 | |
| Sync_6 | 3.50 | 1.02 | –.37 | .17 | –.24 | .33 | |
| Sync_7 | 3.45 | 1.24 | –.41 | .17 | –.90 | .33 | |
| Sync_8 | 3.34 | 1.29 | –.27 | .17 | –1.04 | .33 | |
| Sync_9 | 3.67 | .99 | –.33 | .17 | –.39 | .33 | |
| Sync_10 | 4.03 | 1.07 | –1.15 | .17 | .76 | .33 | |
| Sync_11 | 3.80 | 1.01 | –.63 | .17 | –.19 | .33 | |
| Sync_12 | 3.92 | 1.09 | –.96 | .17 | .38 | .33 | |
| Strength | Str_1 | 3.78 | .91 | –.34 | .17 | –.15 | .33 |
| Str_2 | 3.27 | .99 | –.08 | .17 | –.46 | .33 | |
| Str_3 | 3.08 | 1.16 | –.11 | .17 | –.93 | .33 | |
| Str_4 | 4.06 | .86 | –1.24 | .17 | 2.18 | .33 | |
| Str_5 | 3.71 | .84 | –.25 | .17 | –.23 | .33 | |
| Str_6 | 3.61 | .98 | –.24 | .17 | –.43 | .33 | |
| Str_7 | 3.37 | 1.15 | –.32 | .17 | –.90 | .33 | |
| Str_8 | 3.55 | .82 | .09 | .17 | –.28 | .33 | |
| Str_9 | 3.99 | 1.15 | –1 | .17 | .12 | .33 | |
| Str_10 | 3.28 | .92 | –.16 | .17 | –.18 | .33 | |
| Str_11 | 3.62 | .9 | –.29 | .17 | –.14 | .33 | |
| Str_12 | 3.36 | 1.02 | –.61 | .17 | .001 | .33 | |
| Energy | Ene_1 | 3.57 | .98 | –.12 | .17 | –.72 | .33 |
| Ene_2 | 3.66 | 1.03 | –.83 | .17 | .23 | .33 | |
| Ene_3 | 4.06 | .85 | –.87 | .17 | .62 | .33 | |
| Ene_4 | 3.37 | 1.08 | –.12 | .17 | –.67 | .33 | |
| Ene_5 | 3.41 | .91 | –.02 | .17 | .05 | .33 | |
| Ene_6 | 3.91 | .89 | –.39 | .17 | –.48 | .33 | |
| Ene_7 | 4.28 | .97 | –1.54 | .17 | 2.18 | .33 | |
| Ene_8 | 2.92 | 1.07 | –.01 | .17 | –.59 | .33 | |
| Ene_9 | 3.37 | 1.14 | –.47 | .17 | –.52 | .33 | |
| Ene_10 | 3.22 | .92 | –.05 | .17 | .18 | .33 | |
| Ene_11 | 3.99 | 1.01 | –.99 | .17 | .65 | .33 | |
| Ene_12 | 2.85 | 1.2 | .08 | .17 | –.85 | .33 | |
| Rhythm | Rhy_1 | 3.41 | 1.12 | –.43 | .17 | –.45 | .33 |
| Rhy_2 | 3.80 | 1.02 | –.6 | .17 | –.05 | .33 | |
| Rhy_3 | 4.06 | 1 | –1.06 | .17 | .58 | .33 | |
| Rhy_4 | 3.77 | 1.06 | –.71 | .17 | –.09 | .33 | |
| Rhy_5 | 3.45 | .92 | –.09 | .17 | –.36 | .33 | |
| Rhy_6 | 3.35 | .95 | –.16 | .17 | –.06 | .33 | |
| Rhy_7 | 3.48 | 1.16 | –.56 | .17 | –.42 | .33 | |
| Rhy_8 | 3.08 | .88 | –.03 | .17 | .15 | .33 | |
| Rhy_9 | 4.21 | .97 | –1.23 | .17 | .97 | .33 | |
| Rhy_10 | 3.25 | 1.08 | –.26 | .17 | –.41 | .33 | |
| Rhy_11 | 3.76 | 1.06 | –.73 | .17 | –.09 | .33 | |
| Rhy_12 | 3.46 | .96 | –.28 | .17 | –.14 | .33 | |
| Activation | Act_1 | 3.23 | 1.17 | –.18 | .17 | –.76 | .33 |
| Act_2 | 4.16 | 1.06 | –1.33 | .17 | 1.27 | .33 | |
| Act_3 | 2.18 | 1.18 | .82 | .17 | –.2 | .33 | |
| Act_4 | 4.49 | .87 | –2.05 | .17 | 4.07 | .33 | |
| Act_5 | 3.60 | 1.07 | –.3 | .17 | –.62 | .33 | |
| Act_6 | 4.08 | 1.06 | –1.16 | .17 | .68 | .33 | |
| Act_7 | 3.03 | 1.22 | –.02 | .17 | –.86 | .33 | |
| Act_8 | 2.64 | 1.26 | .34 | .17 | –.89 | .33 | |
| Act_9 | 3.29 | 1.13 | –.15 | .17 | –.70 | .33 | |
| Act_10 | 4.43 | .85 | –1.79 | .17 | 3.50 | .33 | |
| Act_11 | 3.77 | 1.02 | –.49 | .17 | –.17 | .33 | |
| Act_12 | 3.74 | 1.02 | –.42 | .17 | –.39 | .33 | |
3.2. Exploratory Factor Analysis
An EFA (with maximum likelihood method of extraction) was performed for each of the dimensions of the model. In this paragraph will be presented the range of loadings alongside the values of internal consistency (Cronbach’s ɑ) for each dimension of the initial 60-item version of the e-S.F.E.R.A. Questionnaire.
For Synchrony, items explained 21.65% of the variance, with loadings ranging from –.08 to .73 (Cronbach’s ɑ = .69). As regards Strengths, items explained 34.65% of the variance, with loadings ranging from .01 to .78 (ɑ = .81). For Energy, items explained 22.53% of the variance, with loadings ranging from .07 to .73 (Cronbach’s ɑ = .71). For Rhythm, items explained 38.70% of the variance, with loadings ranging from .28 to .81 (Cronbach’s ɑ = .87). Lastly, for Activation, items explained 36.67% of the variance, with loadings ranging from .43 to .79 (Cronbach’s ɑ = .86).
3.3. Confirmatory Factor Analysis
For each single factor, CFA maximum likelihood (ML) estimation was used, except for the Activation factor, where the robust method of estimation (MRL) was used as an alternative [41], considering the non-normal distribution of all items. For the same reasons, the MLR method was used for the five-factor CFAs.
For each CFA of this work, the following cut-offs of the fit indices were followed: values of Comparative Fit Index (CFI) and Tucker-Lewis Index (TLI) > .90/.95 indicate a good fit of the model, as well as values of Root Mean Square Error of Approximation (RMSEA) < .05/.08 indicate an acceptable fit (while scores <.10 indicate a mediocre one) and of Standardized Root Mean Square Residual (SRMR) < .08 [42].
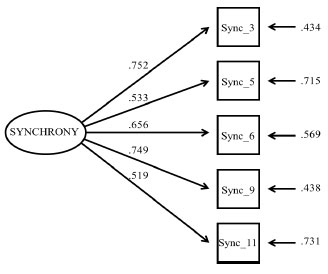
The CFA of the starting 12-item scale of Synchrony (M1) showed a not good fit to the data: χ2(54) = 271.792; p <.001; CFI = .60; TLI = .51; RMSEA = .14 (CI:0.12, 0.15); SRMR = .11. Therefore, following the modification indices, alternative models were tried, deleting the following items: Sync_2 (M2); Sync_7 (M3); Sync_8 (M4); Sync_1 (M5); Sync_4 (M6); Sync_12 (M7); Sync_10 (M8). The last model shows the best fit (Table 3). Loadings ranged from .52 to .75 (Fig. 1).
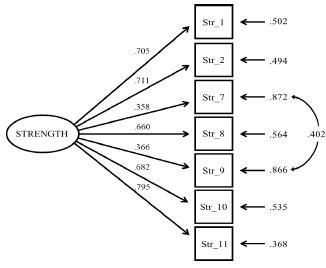
The CFA of the starting 12-item scale of Strength (M1) showed the following not-good-enough fit to the data: χ2(54)= 209.732; p <.001; CFI= .83; TLI= .79; RMSEA= .12 (CI:0.10, 0.13); SRMR= .08. Thus, following the modification indices, alternative models were tried, deleting the following items: Str_12 (M2); Str_3 (M3); Str_4 (M4); Str_5 (M5); Str_6 (M6); and testing the model with the correlation between items Str_9 and Str_7 (M7). The last model shows the best fit (Table 4), with loadings ranging from .36 and .79 (Fig. 2).
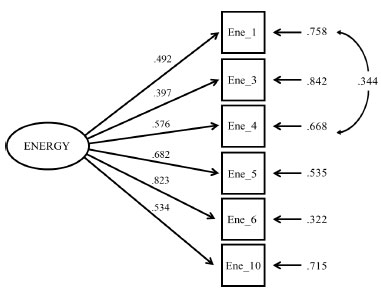
The CFA of the starting 12-item scale of Energy (M1) showed the following not good fit to the data: χ2(54) = 313.924; p <.001; CFI= .57; TLI= .47; RMSEA = .15 (CI:0.13, 0.17); SRMR= .12. Thus, following the modification indices, alternative models were tried, deleting the following items: Ene_9 (M2); Ene_12 (M3); Ene_8 (M4); Ene_2 (M5); Ene_11 (M6); Ene_7 (M7); and testing the model with the correlation between items Ene_4 and Ene_1 (M8). The last model shows the best fit (Table 5), with loadings ranging from .40 and .82 (Fig. 3).
| χ2 | df | p | CFI | TLI | RMSEA | SRMR | Δχ2 (df) | p | |
|---|---|---|---|---|---|---|---|---|---|
| M1 | 271.792 | 54 | < .001 | .60 | .51 | .14 (.12, .15) | .11 | ||
| M2 | 235.933 | 44 | < .001 | .63 | .54 | .14 (.13, .16) | .11 | 35.859 (10) | <.00001 |
| M3 | 193.244 | 35 | < .001 | .67 | .58 | .15 (13, .17) | .10 | 42.689 (9) | <.00001 |
| M4 | 149.252 | 27 | < .001 | .73 | .64 | .15 (.12, .17) | .09 | 43.992 (8) | < .00001 |
| M5 | 141.854 | 20 | < .001 | .72 | .61 | .17 (.14, .20) | .10 | 7.398 (7) | <.00001 |
| M6 | 123.940 | 14 | < .001 | .73 | .60 | .19 (.16, .22) | .11 | 17.914 (6) | <.00001 |
| M7 | 62.894 | 9 | < .001 | .84 | .73 | .17 (.13, .21) | .08 | 61.046 (5) | <.00001 |
| M8 | 10.689 | 5 | .06 | .98 | .96 | .07 (.00, .13) | .03 | 52.205 (4) | <.00001 |
M5: M4 without item 1; M6: M5 without item 4; M7: M6 without item 12; M8: M7 without item 10.
| χ2 | df | p | CFI | TLI | RMSEA | SRMR | Δχ2 (df) | p | |
|---|---|---|---|---|---|---|---|---|---|
| M1 | 209.732 | 54 | < .001 | .83 | .79 | .12 (.10, .13) | .08 | ||
| M2 | 164.342 | 44 | < .001 | .86 | .82 | .11 (.10, .13) | .08 | 45.390 (10) | < .00001 |
| M3 | 152.259 | 35 | < .001 | .83 | .78 | .13 (.11, .15) | .08 | 12.083 (9) | < .00001 |
| M4 | 124.471 | 27 | < .001 | .83 | .78 | .13 (.11, .15) | .08 | 27.788 (8) | < .00001 |
| M5 | 69.416 | 20 | < .001 | .90 | .87 | .11 (.08, .14) | .07 | 55.055 (7) | < .00001 |
| M6 | 63.336 | 14 | < .001 | .90 | .84 | .13 (.10, .16) | .07 | 6.08 (6) | < .00001 |
| M7 | 27.855 | 13 | < .01 | .97 | .95 | .07 (.03, .11) | .04 | 35.481 (1) | < .00001 |
M5: M4 without item 5; M6: M5 without item 6; M7: M6 correlating items 9 and 7.
| χ2 | df | p | CFI | TLI | RMSEA | SRMR | Δχ2 (df) | p | |
|---|---|---|---|---|---|---|---|---|---|
| M1 | 313.924 | 54 | < .001 | .57 | .47 | .15 (.13, .17) | .12 | ||
| M2 | 280.813 | 44 | < .001 | .60 | .14 | .16 (.14, .18) | .12 | 33.111 (10) | < .00001 |
| M3 | 239.795 | 35 | < .001 | .62 | .52 | .17 (.15, .19) | .11 | 41.018 (9) | < .00001 |
| M4 | 216.700 | 27 | < .001 | .64 | .52 | .18 (.16, .20) | .11 | 23.095 (8) | < .00001 |
| M5 | 155.994 | 20 | < .001 | .70 | .58 | .18 (.15, .21) | .10 | 60.706 (7) | < .00001 |
| M6 | 77.482 | 14 | < .001 | .83 | .74 | .15 (.12, .18) | .08 | 78.512 (6) | < .00001 |
| M7 | 44.739 | 9 | < .001 | .88 | .80 | .14 (.10, .18) | .06 | 32.743 (5) | < .00001 |
| M8 | 23.286 | 8 | < .01 | .95 | .91 | .09 (.05, .14) | .04 | 21.453 (1) | < .00001 |
M5: M4 without item 2; M6: M5 without item 11; M7: M6 without item 7; M8: M7 correlating items 4 and 1.
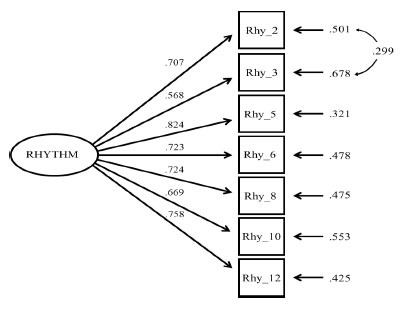
The CFA of the starting 12-item scale of Rhythm (M1) showed the following not-good-enough fit to the data: χ2(54) = 273.962; p <.001; CFI= .79; TLI= .74; RMSEA = .14 (CI:0.12, 0.15); SRMR= .09. Thus, following the modification indices, alternative models were tried, deleting the following items: Rhy_1 (M2); Rhy_7 (M3); Rhy_9 (M4); Rhy_11 (M5); Rhy_4 (M6); and testing the model with the correlation between items Rhy_3 and Rhy_2 (M7). The last model shows the best fit (Table 6), with loadings ranging from .57 and .82 (Fig. 4).
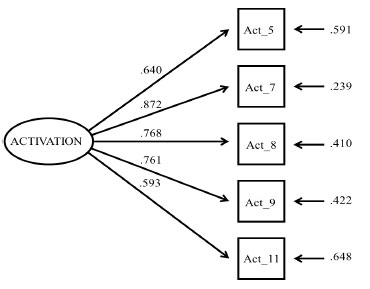
The CFA of the starting 12-item scale of Activation (M1) showed the following not-good-enough fit to the data: χ2(54) = 430.961; p <.001; CFI= .66; TLI= .59; RMSEA = .18 (CI:0.17, 0.20); SRMR= .12. Thus, following the modification indices, alternative models were tried, deleting the following items: Act_3 (M2); Act_2 (M3); Act_10 (M4); Act_6 (M5); Act_4 (M6); Act_1 (M7); Act_12 (M8); and testing the model with the correlation between items Act_8 and Act_5 (M9). The last model shows the best fit (Table 7), with loadings ranging from .59 and .86 (Fig. 5).
| χ2 | df | p | CFI | TLI | RMSEA | SRMR | Δχ2 (df) | p | |
|---|---|---|---|---|---|---|---|---|---|
| M1 | 273.962 | 54 | < .001 | .79 | .74 | .14 (.12, .15) | .09 | ||
| M2 | 211.543 | 44 | < .001 | .83 | .78 | .13 (.12, .15) | .08 | 62.419 (10) | < .00001 |
| M3 | 172.058 | 35 | < .001 | .85 | .81 | .14 (.12, .16) | .07 | 39.485 (9) | < .00001 |
| M4 | 140.007 | 27 | < .001 | .87 | .83 | .14 (.12, .16) | .06 | 32.051 (8) | < .00001 |
| M5 | 102.082 | 20 | < .001 | .90 | .86 | .14 (.11, .17) | .05 | 37.925 (7) | < .00001 |
| M6 | 54.384 | 14 | < .001 | .94 | .91 | .12 (.08, .15) | .04 | 47.698 (6) | < .00001 |
| M7 | 38.577 | 13 | < .001 | .96 | .94 | .10 (.06, .13) | .04 | 15.807 (1) | < .00001 |
M5: M4 without item 11; M6: M5 without item 4; M7: M6 correlating items 3 and 2.
| χ2 | df | p | CFI | TLI | RMSEA | SRMR | Δχ2 (df) | p | |
|---|---|---|---|---|---|---|---|---|---|
| M1 | 350.693 | 54 | < .001 | .64 | .56 | .16 (.15, .18) | .12 | ||
| M2 | 314.812 | 44 | < .001 | .64 | .56 | .17 (.15, .19) | .11 | 35.881 (10) | < .00001 |
| M3 | 256.172 | 35 | < .001 | .67 | .58 | .17 (.15, .19) | .11 | 58.64 (9) | < .00001 |
| M4 | 175.486 | 27 | < .001 | .74 | .66 | .16 (.14, .18) | .09 | 80.686 (8) | < .00001 |
| M5 | 103.580 | 20 | < .001 | .82 | .76 | .14 (.11, .17) | .08 | 71.906 (7) | < .00001 |
| M6 | 80.084 | 14 | < .001 | .85 | .78 | .15 (.12, .18) | .07 | 23.496 (6) | < .00001 |
| M7 | 56.556 | 9 | < .001 | .87 | .79 | .16 (.12, .20) | .06 | 23.528 (5) | < .00001 |
| M8 | 13.591 | 5 | < .05 | .97 | .94 | .09 (.03, .15) | .03 | 42.965 (4) | < .00001 |
M5: M4 without item 6; M6: M5 without item 4; M7: M6 without item 1; M8: M7 without item 12.
Lastly, Table 8 shows the fit indices of the 5-factor models, the first with all 60 items and the second with the remaining 30 items. In the Appendix, we propose an English version of the questionnaire, but future studies need to perform a back translation process to confirm this version [43].
3.4. Relations between the Study Dimensions
Table 9 highlights strong correlations between the five S.F.E.R.A. factors and all other dimensions, the sole exception is Gameaholism, which seems to correlate with Activation only.
Table 8.
| - | χ2 | df | p | CFI | TLI | RMSEA | SRMR |
|---|---|---|---|---|---|---|---|
| M1 | 7236.430 | 1770 | < .001 | .59 | .57 | .08 (.08, .08) | .11 |
| M2 | 3030.857 | 435 | < .001 | .86 | .84 | .07 (.06, .07) | .08 |
| - | ɑ | 1a | 1b | 1c | 1d | 1e | 2a | 2b | 2c | 2d | 3a | 3b | 3c | 3d | 4 | |
|---|---|---|---|---|---|---|---|---|---|---|---|---|---|---|---|---|
| 1a Synchrony | .77 | 1 | ||||||||||||||
| 1b Strength | .80 | .64*** | 1 | |||||||||||||
| 1c Energy | .76 | .63*** | .68*** | 1 | ||||||||||||
| 1d Rhythm | .88 | .65*** | .77*** | .72*** | 1 | |||||||||||
| 1e Activation | .85 | .45*** | .27*** | .34*** | .34*** | 1 | ||||||||||
| 2a Flow Enjoyment | .92 | .42*** | .35*** | .38*** | .36*** | .60*** | 1 | |||||||||
| 2b Flow Int. Motivation | .50 | .28*** | .22** | .25*** | .24** | .45*** | .53*** | 1 | ||||||||
| 2c Flow Absorption |
.88 | .31*** | .14* | .27*** | .22** | .46*** | .52*** | .69*** | 1 | |||||||
| 2d Flow Total |
.90 | .39*** | .27*** | .34*** | .31*** | .58*** | .77*** | .88*** | .89*** | 1 | ||||||
| 3a Engagement Vigor |
.77 | .46*** | .39*** | .45*** | .38*** | .58*** | .64*** | .60*** | .63*** | .73*** | 1 | |||||
| 3b Engagement Dedication |
.83 | .47*** | .38*** | .45*** | .40*** | .68*** | .70*** | .49*** | .57*** | .67*** | .73*** | 1 | ||||
| 3c Engagement Absorption |
.87 | .37*** | .21** | .30*** | .26*** | .55*** | .56*** | .71*** | .84*** | .84*** | .78*** | .68*** | 1 | |||
| 3d Engagement Total |
.92 | .48*** | .36*** | .43*** | .38*** | .67*** | .69*** | .67*** | .75*** | .83*** | .92*** | .88*** | .91*** | 1 | ||
| 4 Gameaholism | .76 | .06 | –.02 | –.04 | –.05 | .27*** | .19** | .16* | .25*** | .23** | .30*** | .26*** | .35*** | .34*** | 1 | |
| Engagement | Flow at Sport |
Game- aholism |
|||||||
|---|---|---|---|---|---|---|---|---|---|
| Vigor | Dedic. | Absor. | Total | Enjoy. | Int. Motiv. | Abs. | Total | ||
| R2 | .42 | .52 | .33 | .50 | .41 | .21 | .24 | .37 | .10 |
| Synchrony | .09 | .05 | .14 | .11 | .05 | .02 | .13 | .09 | .05 |
| Strength | .14 | .09 | –.05 | .06 | .12 | .05 | –.18 | –.01 | .05 |
| Energy | .21* | .17* | .11 | .18* | .09 | .06 | .16 | .12 | –.10 |
| Rhythm | –.10 | –.03 | –.04 | –.06 | –.01 | .00 | .02 | .01 | –.17 |
| Activation | .46*** | .58*** | .048*** | .56*** | .52*** | .40*** | .38*** | .50*** | .32*** |
As regard Cronbach’s ɑ, all dimensions show good internal consistency, except the Intrinsic Sport Motivation subdimension of Flow at Sport. Only two out of five items were selected for this dimension, considering that not all items could fit the characteristics of the sample. Specifically, items related to the motivation to play games in free time, which is tautological, and related to the motivation to play linked to retribution (the research was open to both professional and casual players) were not included, choosing instead those that cover the semantic perimeter of the factor.
Regression analysis (Table 10) shows more nuanced relations: only Activation has a strong influence on the dependent variables, including Gameaholism, while Energy has an influence over the Engagement subdimensions of Vigor and Dedication.
4. DISCUSSION
Demographic data revealed the importance of video games as a source of entertainment: on average, more than 15 hours a week are spent gaming. The population interested in gaming appears still characterized by a strong prevalence of the male gender over the female one.
Following the study's objectives, firstly, the good fit of mono-factorial structures of the e-S.F.E.R.A. factors suggest that these tools could be used independently of each other by sports mental coaches in order to monitor during psychological sessions; this conclusion seems to be also supported by the not-so-good fit indices of the two 5-factor models. When creating and formulating items, it was always assessed if each covered the factor's semantic meaning. Item wording sometimes seemed to repeat themselves but in different ways or with reverse items. Indeed, almost all items that fit best within the model were precisely those that are not worded in reverse. Moreover, the final version items seem to cover the entire semantic range well and retrace the definition of each factor.
As regards the second objective, it is possible to notice the positive link between the Energy factor and the subdimensions of Vigor and Dedication of Engagement. All three of these constructs, in fact, have in common the elements of physical effort and proactivity: for the S.F.E.R.A. model, Energy represents the active use of force, as well as its regulation, but also enthusiasm and readiness, contained in the subdimension of Dynamism. Similarly, for Engagement, Vigor represents the degree of commitment, energy, and resilience invested in one’s activity while Dedication the enthusiasm felt toward it.
Another noteworthy result is the strong relationship observed between the e-S.F.E.R.A. factor of Activation and all dependent variables. Since Activation is described as the emotive and passionate component of motivation, this result could mean that pleasure generated from one's activity and sincere passion toward it may be an important predictor of one's effort and satisfaction, as described by the various subdimensions of Flow and Engagement.
However, a positive relation is also observable between Activation and Gameaholism, thus highlighting a possible dark side of this construct: the passion and dedication felt towards a gaming activity could also be a prelude to the potential development of a video game addiction. As pleasure is central to the construct of activation, it is plausible that it also relates to addictions, as they are founded on the repetitive overstimulation of the brain pleasure center, the Nucleus Accumbens [44].
LIMITATIONS
Before ending the discussion, it is important to dwell on the limitations of the study. Firstly, the convenience sample: the investigation was open to anyone playing an online competitive video game; therefore, numerous non-professional gamers also contributed. Thus, this study should not be considered as completely focused on professional esporters, but a starting point for investigating the mental factors that impact and could improve performance in the context of competitive video gaming. Furthermore, the low amount of professionals and the heterogeneity of our sample prevent us to generalise results for the gamer population. Then, a number of different games and different genres were considered. Although all games considered share the competitive aspect, it was not possible to make a clear distinction between which is actually an esport and which is not.
FUTURE DEVELOPMENTS
The results suggest the importance of future research to investigate which other classical psychological dimensions the S.F.E.R.A. factors of Synchrony, Rhythm and Strength could be linked to. For example, the latter may show some meeting points with the construct of self-efficacy, defined as an individual's belief in their capacity to act in the ways necessary to reach specific goals [45, 46] and directly referred to in the original model’s definition of this dimension [25]. Furthermore, as S.F.E.R.A. is a model ultimately designed to reach maximum performance in sports competitions [47], the relation between its factors and actual performance indicators (such as victories in tournaments or different kinds of scores) should be investigated.
Contextually, future research could highlight longitudinal fluctuations in S.F.E.R.A. dimensions scores in professional eplayers before and after taking part in a program of psychological optimization with professional sports psychologists.
Moreover, the apparent strong relation of Activation to pleasure and passion toward an activity, and the risk of developing an addiction to it, could be more deeply investigated. Finally, the difference in the percentage points between respondents who claim to have participated in an official competition and those who define themselves as advanced players show how blurry the boundary is between who is and who is not an eplayer. As an exploratory study, this study did not follow such a specific goal, but if future research wants to focus on eplayers only, then the characteristics of professional eplayers should be defined more strictly.
CONCLUSION
The results of this research are a mirror of reality. The esports phenomenon is emerging in an increasingly important way in recent times and especially in Asia, less so in Italy. Professionalism in esports in Italy is still not so widespread, where there is also a high turnover of players within teams. Considering, however, the evolution of the phenomenon, it could be wise for sports psychologists to be equipped with all the necessary tools, skills, and preparation to be able to support this kind of athlete that is emerging so quickly, even in the Italian context, albeit at a different pace (or “Rhythm”, speaking in the S.F.E.R.A. slang).
Participants gave their written informed consent to participate in this study.
ETHICS APPROVAL AND CONSENT TO PARTICIPATE
Ethical review and approval were not required for the study on human participants per local legislation and institutional requirements.
HUMAN AND ANIMAL RIGHTS
No animals were used for studies that are the basis of this research. All the humans were used in accordance with the ethical standards of the committee responsible for human experimentation (institutional and national), and >with the Helsinki Declaration of 1975, as revised in 2013 (http://ethics.iit.edu/ecodes/node/3931).
CONSENT FOR PUBLICATION
Participation in the study was anonymous and voluntary, and all participants were adults.
STANDARDS OF REPORTING
STROBE guidelines were followed.
AVAILABILITY OF DATA AND MATERIALS
The data that support the findings of this study are available within the article.
FUNDING
None.
CONFLICT OF INTEREST
The authors report there are no competing interests to declare.
ACKNOWLEDGEMENTS
The authors would like to thank: the expert sports psychologists Dr. Matteo Gabiano and Dr. Manuel Toscano for their feedback during the item formulation; the expert esporters and gamers Dr. Ginevra Cataldi and Dr. Elena Del Fante for their feedback on item adjustment; and Dr. Barbara Cerato for the recruitment of eplayers and gamers into the study.
| Factor |
English version During the game that I thought about… |
Italian version Durante la partita a cui ho pensato… |
|
|---|---|---|---|
| Synchrony | Sync_3 | Thoughts and actions coincided | Pensieri e azioni coincidevano |
| Sync_5 | I felt I had everything under control | Sentivo di avere tutto sotto controllo | |
| Sync_6 | I had in mind all actions to be carried out “step by step” | Avevo in mente le azioni da svolgere “passo dopo passo” | |
| Sync_9 | I could effortlessly perceive the signals coming from the game situation | Riuscivo a percepire senza sforzo i segnali che provenivano dalla situazione di gioco | |
| Sync_11 | My thinking was completely focused on the action | Il mio pensiero era completamente focalizzato sull’azione | |
| Strength | Str_1 | I was aware of my strengths | Ero consapevole dei miei punti di forza |
| Str_2 | I knew I could perfectly perform every move | Sapevo di essere perfettamente in grado di eseguire ogni mossa | |
| Str_7 | I was afraid of not being able to tackle possible issues | Avevo timore di non riuscire ad affrontare eventuali criticità | |
| Str_8 | I knew exactly which skills to employ at different times | Sapevo esattamente quali abilità impiegare nei diversi momenti | |
| Str_9 | I was afraid of breaking me down when faced with the first difficulties | Avevo paura di abbattermi di fronte alle prime difficoltà | |
| Str_10 | I felt that I could effectively deal with unexpected situations and problems | Sentivo di poter affrontare efficacemente situazioni e problemi inaspettati | |
| Str_11 | I felt able to achieve the goals | Mi sentivo in grado di raggiungere gli obiettivi | |
| Energy | Ene_1 | I acted in a gritty way | Agivo in maniera grintosa |
| Ene_3 | I wasn’t able to let my energies flow | Non riuscivo a far fluire le energie | |
| Ene_4 | I felt filled with grit for its entire duration | Mi sono sentito pieno di grinta per tutta la sua durata | |
| Ene_5 | I knew how to regulate my forces | Ho saputo regolare le mie forze | |
| Ene_6 | I felt determined | Mi sentivo determinato | |
| Ene_10 | I was able to regulate my energies to perform at my best | Riuscivo a regolare le mie energie per rendere al meglio | |
| Rhythm | Rhy_2 | Thoughts, movements and commands came naturally to me | Pensieri, movimenti e comandi mi venivano naturali |
| Rhy_3 | I was awkward in my movements | Ero impacciato nei movimenti | |
| Rhy_5 | I moved with the right timing | Mi muovevo con il giusto tempismo | |
| Rhy_6 | I dedicated the necessary time to each action | Ho dedicato a ciascuna azione il tempo necessario | |
| Rhy_8 | I did everything at the appropriate time | Ho fatto ogni cosa al momento opportuno | |
| Rhy_10 | I was moving forward without indecision | Andavo avanti senza indecisioni | |
| Rhy_12 | The rhythm of my actions was well suited to that situation | Il ritmo con cui agivo era giusto per quella situazione | |
| Activation | Act_5 | I couldn’t wait to get started | Non vedevo l’ora di iniziare |
| Act_7 | I felt that what I was doing had an important meaning for me | Sentivo che ciò che facevo aveva un significato importante per me | |
| Act_8 | I felt I could fulfil myself by doing that activity | Sentivo di potermi realizzare svolgendo quell’attività | |
| Act_9 | I felt proud of what I was doing | Mi sentivo fiero di quello che facevo | |
| Act_11 | I felt motivated to reach the goals that I had set | Ero motivato a raggiungere gli obiettivi che mi ero posto |
LIST OF ABBREVIATIONS
| IGD | = Internet Gaming Disorder |
| PST | = Psychological Skill Training |
| CMV | = Common Method Variance |