All published articles of this journal are available on ScienceDirect.

Model of Cyber Victimization: Study on College Student in Indonesia
Authors Info & Affiliations
Abstract
Background
Cyber victimization is an emerging concern in the digital age, affecting a significant number of internet users, especially youth. This study aims to explore the psychological and behavioral factors contributing to cyber victimization, focusing on brief sensation seeking and youth psychopathy as independent variables, with social interaction anxiety as a mediator.
Methods
This quantitative study involved 447 internet-active students from various cities in Indonesia. Data were analyzed using Partial Least Squares (PLS) 3.0. The research model examined the direct and mediated effects of brief sensation seeking and youth psychopathy on cyber victimization, with social interaction anxiety as a mediator.
Results
The analysis revealed that both brief sensations seeking, and youth psychopathy significantly influence cyber victimization through social interaction anxiety. Additionally, social interaction anxiety was found to have a positive direct effect on cyber victimization. Model fitness tests, including R Square, Q Square, F Square, Goodness of Fit Index, SRMR, and PLS Predict, confirmed the robustness and coherence of the proposed model.
Conclusion
This study provides a nuanced understanding of the factors contributing to cyber victimization among youth, highlighting the critical roles of sensation seeking, psychopathy traits, and social interaction anxiety. The findings underscore the importance of addressing psychological and behavioral components to mitigate the risk of cyber victimization. Future research should further investigate these relationships and develop targeted interventions to reduce cyber victimization.
The cyber victimization model consists of brief sensation seeking, youth psychopathy, and social interaction anxiety, with cyber victimization as a constituent variable of the model. The research on the cybervictimization model is still limited. Therefore, conceptual testing of this model will positively impact the cyber victimization literature and practical implications for preventing and managing cyber victimization. The tested conceptual model can be valuable for mental health practitioners as a psychoeducational guide for individuals vulnerable to cyber victimization.
This research exhibits several weaknesses, encompassing internal validity, external validity, and statistical analysis. Internal validity is compromised by Common Method Bias, arising when data is collected from a single source or measurement method, potentially distorting analyses. Respondents answering multiple variables in one questionnaire pose a weakness, as they may tend to give consistent responses without considering actual differences in measured variables. This can inflate relationships between variables in statistical analysis, creating stronger or artificial connections. External validity weakness pertains to how study results or measurement instruments can be applied or generalized beyond the study's specific context. In this research, potential cognitive and emotional effects may impact external validity, as changes in respondents' emotional or cognitive states between self-reporting and real situations may occur. Statistical analysis weaknesses arise in PLS usage due to its sensitivity to outliers. PLS can be significantly affected by outliers, introducing instability to the model. This instability becomes apparent when testing the model on different datasets or using it to predict outcomes on new data.
1. INTRODUCTION
“Cyber bullies can hide behind a mask of anonymity online, and do not need direct physical access to their to do unimaginable harm” Quote by Anna Maria Chavez.
The quote above depicts the unseen scope of cyberbullying, a part of cybervictimization, highlighting its profound psychological impact, often leading to tragic outcomes such as suicide. Cyberbullying has surged with technological advancements and is defined as “intentional, aggressive acts perpetrated by a group or individual, repeatedly and over time, against a victim who cannot easily defend themselves [1].” The incidence of cyber- bullying is on the rise globally, mirroring the increasing number of internet users [2]. In Indonesia, where 73.7% of the population, equivalent to 196.7 million people, are internet users [3], cyberbullying cases are prevalent [4] Research across 28 countries in Asia, Europe, and America from 2018-2023 reveals a rising trend in cyberbullying instances [5]. Over 40% of bullying cases occur on social media.
Cyber victimization results from technological advancements, primarily internet use, with 4.9 billion active internet users worldwide. It encompasses various forms of harm or aggression occurring online, such as verbal or non-verbal abuse, online stalking, fraud, identity theft, defamation, or cyberattacks, severely impacting emotional and mental well-being. Victims of cyber victimi- zation are referred to as cyber victims, often overlapping with those who experience cyberbullying involving name-calling, physical mockery, or online threats [6]. The incidence of cyber victimization is increasing, with research indicating that 39.9% of students have expe- rienced it [7], with implications for severe emotional disturbances and, in extreme cases, self-harm or suicide.
While anyone can become a cyber victim, certain groups appear more vulnerable. Digital literacy, internet usage habits, and personal cybersecurity can influence susceptibility to cyber victimization [8]. Individual characteristics play a crucial role; those with lower self-confidence, emotional instability, or less vigilance may be more vulnerable to cyber threats [9]. Individuals with dark personality traits like narcissism, psychopathy, and emotional manipulation are also at higher risk [10].
According to a study [11], individuals categorized as having brief sensation-seeking tendencies are more vulnerable to cyber victimization due to their inclination to seek new and intense experiences, potentially taking risks online without fully considering the associated threats. Additionally, those with social interaction anxiety may prefer online interactions, feeling safer in digital platforms, making them less vigilant to potential online dangers [12].
Despite these assumptions being supported by research, empirical testing is needed. Understanding the characteristics and patterns of cyber victimization through a model-based approach is essential. Research on cyber victimization models can shed light on factors making specific individuals more susceptible to cyberattacks. Such studies provide insights into complex causal relationships, explaining how independent variables affect dependent variables through mediators. Knowledge of cyber victimi- zation models can aid in preventing its occurrence, focusing on protection, safety measures, and psychological interventions for at-risk individuals.
Previous studies on cyber victimization models have investigated factors like family dynamics, family communi- cation, social support, emotion regulation difficulties [13], emotional and social loneliness, social efficacy, and well-being [14]. This current research focuses on youth psycho- pathy, brief sensation seeking, and social interaction anxiety as mediator variables. Understanding internal factors as protective elements against cyber victimization can enhance resilience against external stressors and provide long-term psychological protection.
1.1. Cyber Victimization
Cyber victimization is defined as the targeting of an individual through harmful actions in a digital setting, originating from adolescent aggression and collaborative electronic activities [15]. Cybervictim refers to the victim of cyberbullying, and cyber victimization is the experience of being the target of aggressive or harmful actions conducted online, such as on social media or other digital platforms. It encompasses behaviors like harassment, defamation, threats, or spreading false or embarrassing information about someone online. Cybervictims may experience various unpleasant incidents, including having their personal information taken from their phones, their identity used by others to disseminate specific content, being made the subject of content that induces shame, and more [16]. Numerous studies indicate the adverse effects experienced by cyber victims, including feelings of depression, stress, suicidal ideation, social anxiety, low self-esteem, help- lessness, anxiety, anger, and frustration.
While research involving cyber victims has been extensive, it has primarily focused on adolescents, with limited studies on college students. Furthermore, previous research has often concentrated on the impact of cyberbullying on cyber victims, exploring factors causing the emergence of cyberbullying behavior. Some studies in this domain include [17], examining the relationship between parenting styles and self-esteem among adolescents involved in cyberbullying. The research suggests that parenting emphasizing discussion and avoiding coercion has a positive effect on preventing cyberbullying. A study [18] investigated the link between cyber victimization and suicidal thoughts among French teenagers, finding a connection between cyber victimi- zation and suicidal ideation. A study [19] discussed cyber victimization among high school students, considering social media interaction time, personality traits, and parental education. The results indicate that those who spend more time interacting online, have unstable personality traits, and have lower parental education levels are more vulnerable to cyber victimization. Other studies focused on topics such as resilience in the well-being of cyber-victimized adolescents [20], cyberbullying in social media and online games among Chinese college students [21], the impact of cyberbullying on the academic, social, and emotional development of students [22], and university students' attitudes toward cyber- bullying [23].
The summary of the above research indicates that studies on cyber victimization are often centered around correlational research, examining the relationship between variables X and Y, with a scarcity of studies testing cyber victimization models. This study aims to fill this research gap by investigating the model of cyber victimization. It is assumed that factors such as social interaction anxiety, youth psychopathy, and brief sensation seeking also contribute to the influence of cyber victimization.
The main objective of this research is to investigate the factors contributing to cyber victimization among individuals, particularly focusing on college students. The study aims to understand how internal factors such as youth psychopathy, brief sensation seeking, and social interaction anxiety contribute to the likelihood of becoming a cyber victim. Additionally, it aims to explore the mediating role of social interaction anxiety in the relationship between these factors and cyber victimization.
This study will be conducted in several universities across in Riau Province and West Sumatera in Indonesia. Recruitment of participants will commence in April 2023 and continue until June 2023. The exposure to the study variables, including youth psychopathy, brief sensation seeking, and social interaction anxiety, will occur during the data collection period, which spans from July 2023 to end September 2023. Data collection will be completed by October 2023, and data analysis is scheduled to commence immediately afterward.
1.2. Study Design
This research adopts a cross-sectional study design to investigate the factors contributing to cyber victimization among college students. A convenience sampling method will be employed to recruit participants from various universities, ensuring a diverse representation of the student population. The study will utilize validated scales to measure youth psychopathy, brief sensation seeking, social interaction anxiety, and cyber victimization experiences among participants. Data collection will involve self-report. Statistical analyses, including regression analysis and mediation analysis, will be conducted to examine the relationships between the independent variables (youth psychopathy, brief sensation seeking, social interaction anxiety) and the dependent variable (cyber victimization). Mediation analysis will explore the mediating role of social interaction anxiety in the relationship between brief sensation seeking, youth psychopathy, and cyber victimization. Ethical considera- tions, including obtaining informed consent from participants and ensuring confidentiality of data, will be strictly adhered to throughout the study.
Based on the above discussion, the following hypotheses can be proposed for this research:
1. Brief Sensation seeking positively influences cyber victimization.
2. Youth Psychopathic positively influences cyber victimization.
3. Social interaction anxiety positively influences cyber victimization.
4. Brief Sensation Seeking positively influences Social Interaction Anxiety.
5. Youth Psychopathy positively influences Social Interaction Anxiety.
6. Social interaction anxiety significantly mediates the relationship between brief Sensation-seeking and cyber victimization.
7. Social interaction anxiety significantly mediates the relationship between youth psychopathy and cyber victimization.
2. METHODS
The research, which has obtained approval from the faculty-level Research Ethics Committee, where the researcher is affiliated, encompassed a comprehensive study involving 447 students across the provinces of Riau and West Sumatra, with data collection spanning from May to July 2023. Data regarding the participants can be seen in Table 1, which illustrates the demographic data of the participants.
The sample size of 447 internet-active college students from two cities in Indonesia was determined through statistical considerations and practical constraints. Using an assumption of a significance level of 0.05, which means there is a 5% chance of detecting an effect that does not indeed exist (false positive), and a statistical power of 0.80, which means there is an 80% chance of detecting an effect that genuinely exists (true positive), the required sample size typically falls within the range of 300-500 participants. A sample size of 447 falls within this range and meets the statistical power requirements. This ensures that the study has sufficient power to detect significant effects in the proposed model. The feasibility of recruiting many participants within the available time frame and resources was also a consideration. This study was designed to maximize participant engagement and response rates through targeted recruitment approaches and efficient data collection methods.
| Data | Percentage | Number |
|---|---|---|
| Sex | - | - |
| Male | 17.00% | 77 |
| Female | 83.00% | 370 |
| Social media | - | - |
| YouTube | 1.79% | 8 |
| lain-lain | 2.01% | 9 |
| Tiktok | 8.72% | 39 |
| 67% | 300 | |
| Instagram* | 20% | 91 |
| - | 100.24% | - |
| Duration using internet | - | - |
| 1-4 hours/day | 14.52% | 65 |
| 4-6 hours/days | 31.54% | 141 |
| more than 6 hours | 53.83% | 241 |
To gather responses from the student participants, the researchers employed a digital approach, utilizing the Google Form platform for the research questionnaire. The process involved distributing the research link to students who expressed interest in becoming respondents for the study. The use of digital surveys through Google Forms not only facilitated efficient data collection but also allowed for a streamlined and organized approach to managing the responses. This modern methodology aligns with contemporary research practices, leveraging tech- nology to enhance the accessibility and reach of the study. The selection of Riau and West Sumatra as the research locations adds a regional dimension, potentially capturing diverse perspectives and experiences among the participating students. The extensive number of respon- dents indicates a robust sample size, enhancing the reliability and generalizability of the study's findings.
The participation criteria for this study were college students who have social media accounts and actively use social media. The sampling technique used was purposive sampling. The participation criteria for this study were college students who have social media accounts and actively use social media. Participants were required to be within the age range of typical college students (18-25 years old). They were recruited from the provinces of West Sumatra and Riau. The sampling technique used was purposive sampling. Purposive sampling was chosen because it allows for the selection of participants who meet specific criteria that are crucial for the research objectives. In this study, the focus was on understanding cyber victimization among college students who are active social media users. By using purposive sampling, we ensured that the participants had relevant experiences and characteristics necessary for providing meaningful insights into the factors contributing to cyber victimization. This method also facilitated the recruitment of a diverse group of students from different regions, enhancing the generalizability of the findings within the specified geographic scope
Data on cyber victimization were obtained through a scale developed previous study [16]. This Likert scale consists of 11 items with response options ranging from never, once, two or three times, more than three times (score values for responses ranging from 5, 4, 3, 2, 1). Youth psychopathic, brief sensation seeking, and social interaction anxiety were measured using scales [24]. Brief sensation seeking was measured with a sensation-seeking scale, with response options being strongly agreed, agree, neutral, disagree, and strongly disagree (scores for responses ranging from (5, 4, 3, 2, 1). Social interaction anxiety was measured with the social anxiety scale with responses ranging from not at all, slightly agree, somewhat agree, strongly agree, and very strongly agree (scores for responses ranging from 5, 4, 3, 2, 1). Youth psychopathic traits were measured with the youth psychopathic traits inventory scale, with response options being strongly agree, agree, disagree, and strongly disagree (scores for responses ranging from 4, 3, 2, 1).
All scales used were adapted linguistically and culturally into the Indonesian language, following the principles of adapting scales linguistically and culturally [25]. This process received permission from the original scale authors (through email correspondence).
2.1. Data Analysis Method
The research questionnaire was distributed to approximately 500 research participants, but among these questionnaires, only 447 were completed by the participants. The rest could not be analyzed due to incomplete answers on the questionnaire or participants only filling out the identity section but not completing the questionnaire. The data will be analyzed using PLS-SEM with the PLS V3RSI 3.0 software; the analysis involved both the outer and inner models using Partial Least Squares (PLS) 3.0. The outer model analysis focused on assessing the measurement quality of the observed variables (indicators) used to represent the research model's latent constructs (variables of interest). This included evaluating indicators' reliability (internal consistency) using measures like Cronbach's alpha and composite reliability. The validity of the measurement model was examined through convergent validity (average variance extracted, factor loadings) and discriminant validity (cross-loadings, Fornell-Larcker criterion, heterotrait-monotrait ratio)—inner Model Analysis. The inner model analysis examined the research model's relationships between latent variables (constructs). This included testing the hypothesized paths (relationships) between brief sensation seeking, youth psychopathy, social interaction anxiety, and cyber victimization using regression weights and path coefficients. The role of social interaction anxiety as a mediator in the relationships between brief sensation seeking, youth psychopathy, and cyber victimization was assessed using mediation analysis techniques. Model fit indices such as R Square, Q Square, Goodness of Fit Index (GoF), Standardized Root Mean Square Residual (SRMR), and Predictive Relevance (PLS Predict) were evaluated to assess the overall fit and predictive power of the structural model. Interpreting significant paths and coefficients provided insights into the direct and mediated effects of the variables in the research model. PLS-SEM is justified because this research is predictive [26], specifically testing the cyber victims model. The proposed cybervictims model is reflective, where each measurement item reflects the measured variable [27]. This cyber victims model is first order, where measurement items directly measure each variable. Two model testing stages are run using PLS-SEM: the outer and inner models. The outer model aims to examine the psychometric properties of the measurement tool, and the inner model aims to test hypotheses [26].
3. RESULTS
3.1. Demographic Data
Table 1 shows that most participants are female (83%), WhatsApp is the most widely used social media (67%), and the most extended duration of internet use is more than 6 hours (53.83%).
Table 2 provides an overview of the types of bullying experienced by the study participants. Based on the percentage of cyber victim experiences provided in the table, it can be concluded that the three most commonly experienced types of online harassment by cyber victims are the spread of the victim's personal information from a computer or smartphone without permission (51.3%), the dissemination of content on online or digital media using the victim's identity (50.67%), and the invitation of others to watch the victim's private video chat without prior permission (36.22%).
3.2. Measurement Model or Outer Model
The measurement model serves as a crucial component in research methodology, playing a pivotal role in evaluating the psychometric properties of the measuring instrument employed. One of the key aspects under scrutiny within this model is the assessment of convergent validity, a critical indicator of the extent to which different measures of the same construct converge. This evaluation involves an examination of factor loading values, which signify the strength and direction of the relationships between observed variables and their underlying latent constructs. Additionally, convergent validity is gauged through composite reliability, a measure of the internal consistency of the latent variables, and average variance extracted, which reflects the proportion of variance captured by the latent variables in relation to measurement error. The outer model assessment aims to reduce bias in measurement tools.
| No. | Cyber Victimization | Percentage |
|---|---|---|
| 1 | Dissemination of the victim's personal information from their computer or smartphone without permission. | 51.33% |
| 2 | Sharing content on the internet or online media using the victim's identity. | 50.67% |
| 3 | Being invited by others to watch the victim's private video chat without asking for permission first. | 36.22% |
| 4 | Receiving comments that embarrass and hurt feelings in online posts. | 34.67% |
| 5 | Receiving messages with the intent of threatening, hurting feelings, and embarrassing on the internet. | 26.89% |
| 6 | Experiencing blocked access to the victim's online account by stealing the password. | 26.00% |
| 7 | Receiving messages via short message services (SMS) with the intent of threatening, hurting feelings, and embarrassing. | 24.44% |
| 8 | Experiencing deception by falsifying the victim's gender while engaging in online activities. | 17.33% |
| 9 | Facing the spread of gossip and rumors online. | 15.33% |
| 10 | Hearing offensive or insulting words online. | 14.67% |
| 11 | Experiencing the dissemination of messages, photos, or videos that embarrass the victim online without the victim's consent | 14.22% |
In tandem with convergent validity, the measurement model delves into the assessment of discriminant validity, a concept integral to ensuring that distinct constructs remain distinct. Discriminant validity is scrutinized through various metrics, with a key focus on Heterotrait Monotrait Ratio (HTMT) values. This ratio provides insights into the extent to which the correlation between different constructs (Heterotrait) differs from the correlation between items within the same construct (Monotrait). Furthermore, the Fornell-Larcker criterion, another determinant of discri- minant validity, examines whether the square root of the average variance extracted for each construct exceeds its correlation with other constructs [26, 27]. By rigorously evaluating both convergent and discriminant validity, the measurement model establishes the robustness and reliability of the measuring instrument, bolstering the credibility and validity of the research findings.
3.3. Loading Factor
In the context of structural equation modeling, outer loading assumes significance as a crucial metric illuminating the correlation between an indicator and its latent variable. This correlation serves as a key determinant of the strength and reliability of the measurement, influencing the overall robustness of the model. The outer loading values are indicative of the extent to which an observed variable aligns with its underlying latent construct. A higher outer loading value signifies a more robust relationship, underlining the indicator's capacity to adequately represent the latent variable. The threshold for acceptable outer loading values is conventionally set at > 0.7, signifying a substantial correlation that can explain around 50% of the variability in the indicator through its latent variable.
| - | Brief Sensation Seeking |
Cybervictimization | Social Interaction Anxiety |
Youth Psychopatic |
|---|---|---|---|---|
| BSI2 | 0.599 | - | - | - |
| BSI3 | 0.508 | - | - | - |
| BSI5 | 0.724 | - | - | - |
| BSI6 | 0.888 | - | - | - |
| CI1 | - | 0.849 | - | - |
| CI10 | - | 0.828 | - | - |
| CI11 | - | 0.925 | - | - |
| CI2 | - | 0.880 | - | - |
| CI3 | - | 0.850 | - | - |
| CI4 | - | 0.948 | - | - |
| CI5 | - | 0.965 | - | - |
| CI6 | - | 0.953 | - | - |
| CI7 | - | 0.958 | - | - |
| CI8 | - | 0.911 | - | - |
| CI9 | - | 0.897 | - | - |
| SIA1 | - | - | 0.667 | - |
| SIA10 | - | - | 0.822 | - |
| SIA13 | - | - | 0.669 | - |
| SIA14 | - | - | 0.683 | - |
| SIA15 | - | - | 0.695 | - |
| SIA17 | - | - | 0.726 | - |
| SIA18 | - | - | 0.787 | - |
| SIA19 | - | - | 0.647 | - |
| SIA20 | - | - | 0.842 | - |
| SIA21 | - | - | 0.620 | - |
| SIA6 | - | - | 0.813 | - |
| SIA7 | - | - | 0.831 | - |
| SIA8 | - | - | 0.820 | - |
| YPT1 | - | - | - | 0.768 |
| YPT2 | - | - | - | 0.824 |
| YPT3 | - | - | - | 0.529 |
| YPT4 | - | - | - | 0.802 |
| YPT5 | - | - | - | 0.758 |
Table 4.
| Cronbach's Alpha | rho_A | Composite Reliability | Average Variance Extracted (AVE) |
|
|---|---|---|---|---|
| Brief Sensation Seeking | 0.694 | 0.714 | 0.781 | 0.482 |
| Cybervictimization | 0.978 | 0.981 | 0.981 | 0.823 |
| Social Interaction anxiety | 0.933 | 0.952 | 0.941 | 0.554 |
| Youth Psychopatic | 0.791 | 0.808 | 0.859 | 0.553 |
| Brief Sensation Seeking | Cybervictimization | Social Interaction anxiety | Youth Psychopatic |
|---|---|---|---|
| Brief Sensation Seeking | - | - | - |
| Cybervictimization | 0.132 | - | - |
| Social Interaction anxiety | 0.171 | 0.709 | - |
| Youth Psychopathic | 0.477 | 0.163 | 0.218 |
Conversely, indicators with outer loading values < 0.4 are typically considered for elimination from the analysis process. A value below this threshold suggests a weaker correlation and raises questions about the reliability of the indicator in capturing the underlying construct. The decision to eliminate variables is driven by the aim to enhance composite reliability or average variance extracted, ultimately refining the overall measurement model. This strategic elimination ensures that the retained indicators are robust representatives of their latent variables.
It is noteworthy that the outer loading values for all variables under consideration can be found in Table 3. This table serves as a comprehensive reference point, offering insights into the correlation strength between each indicator and its corresponding latent variable. The meticulous evaluation and interpretation of outer loading values contribute significantly to the refinement and optimization of the measurement model, ensuring its efficacy in capturing the complexity of the latent constructs under investigation.
The lowest outer loading is 0.508, identified in variable BSI3, while the highest outer loading is 0.965, found in variable CI5. An outer loading value of 0.508 is still acceptable, provided that the Average Variance Extracted (AVE) value is satisfactory. Convergent validity is assessed by evaluating loading factors, Composite Reliability (CR), and Average Variance Extracted (AVE).
3.4. Average Variance Extracted (AVE)
The Average Variance Extracted (AVE) serves as a pivotal metric in structural equation modeling, gauging the extent to which a latent variable or construct can elucidate the variance within its corresponding indicators. Essentially, the AVE reflects the average proportion of variability captured by a latent variable, offering insights into the effectiveness of the construct in explaining the shared variance among its indicators. A higher AVE implies a more robust construct, indicating that it has successfully absorbed and accounted for a substantial portion of information from its indicators. In this study, the AVE is a crucial indicator, with values above 0.5 considered acceptable, as they signify that the latent variable has captured over 50% of the variance in its indicators.
Table 4 provides a comprehensive overview of the AVE values for each variable under scrutiny. Generally, all variables exhibit AVE values surpassing the 0.5 threshold, signifying their efficacy in explaining the shared variance within their respective indicators. Notably, the brief sensation-seeking variable stands out with an AVE value slightly below 0.5, registering at 0.482. However, this discrepancy is acceptable, as construct validity can still be maintained if the Composite Reliability (CR) exceeds 0.6, as suggested by [28]. In this case, the CR value for the brief sensation-seeking variable stands at a robust 0.78, emphasizing the construct's reliability and validating its inclusion in the overall measurement model.
In essence, the meticulous examination of AVE values, as presented in Table 4, contributes to a nuanced understanding of each latent variable's ability to capture and elucidate the underlying variability within its indicators. These findings bolster the construct validity of the measurement model, offering a robust foundation for subsequent analyses and interpretations.
3.5. Heterotrait Monotrait Ratio (HTMT)
In structural equation modeling, the Heterotrait-Monotrait Ratio of Correlations (HTMT) is a crucial metric employed to assess discriminant validity. Specifically, HTMT values offer insights into the extent to which constructs within a model are distinct from one another. The widely accepted recommendation for HTMT values is that they should be below 0.85 or, more conservatively, below 0.90 [29]. HTMT values for all the following variables are below 0.85, as explained in Table 5.
Discriminant validity is fundamental in ensuring that the constructs under consideration are measuring distinct phenomena and are not excessively correlated, preventing potential issues of multicollinearity. Ensuring adequate discriminant validity is vital for the credibility and reliability of structural equation models. It provides confidence that the constructs under investigation are indeed capturing unique aspects of the phenomena they are intended to measure. Consequently, adherence to the suggested HTMT thresholds is a critical step in establishing the robustness and validity of the measure- ment model, contributing to the overall rigor of the research findings.
The Fornell-Lacker Criterion measures involve comparing the Average Variance Extracted (AVE) square root with the correlations between variables. According to Fornell and Lacker's criteria, a model has good discriminant validity when the square root of the AVE of each variable is greater than the correlation between variables. The AVE values for each variable are greater than the correlations between variables, as seen in Table 6. This indicates that the variable shares more variance with its measures than with measures of other variables.
The HTMT values and Fornell-Larcker values for the variables in this study meet the predefined threshold.
3.6. Structural Model or Inner Model
In the realm of structural equation modeling, the testing of the inner model is a multifaceted process encompassing hypothesis testing, significance testing, and evaluating the overall fitness of the model [30]. These assessments are crucial steps in gauging the effectiveness of the proposed structural model in explaining relation- ships between latent constructs and observed variables. The use of Smart PLS 3 as a tool for conducting these assessments provides a robust framework for model evaluation.
Model fitness is a key aspect of inner model testing, and it involves several pertinent measures. R Square, Q Square, F Square, Goodness of Fit Index, Standardized Root Mean Square Residual (SRMR), and PLS Predict are among the metrics employed to assess how well the model aligns with the observed data. R Square, for instance, quantifies the variance explained by the endogenous latent variables, shedding light on the model's explanatory power. Q Square, on the other hand, assesses the predictive relevance of the model, providing insights into its capability to forecast outcomes.
F Square is instrumental in evaluating the effect size of the model, indicating the proportion of variance in the dependent variable explained by the independent variables. The goodness of Fit Index offers a holistic assessment of how well the model fits the data. Meanwhile, SRMR gauges the discrepancy between the observed and predicted covariances, contributing to the assessment of model fit. PLS Predict focuses on the predictive accuracy of the model.
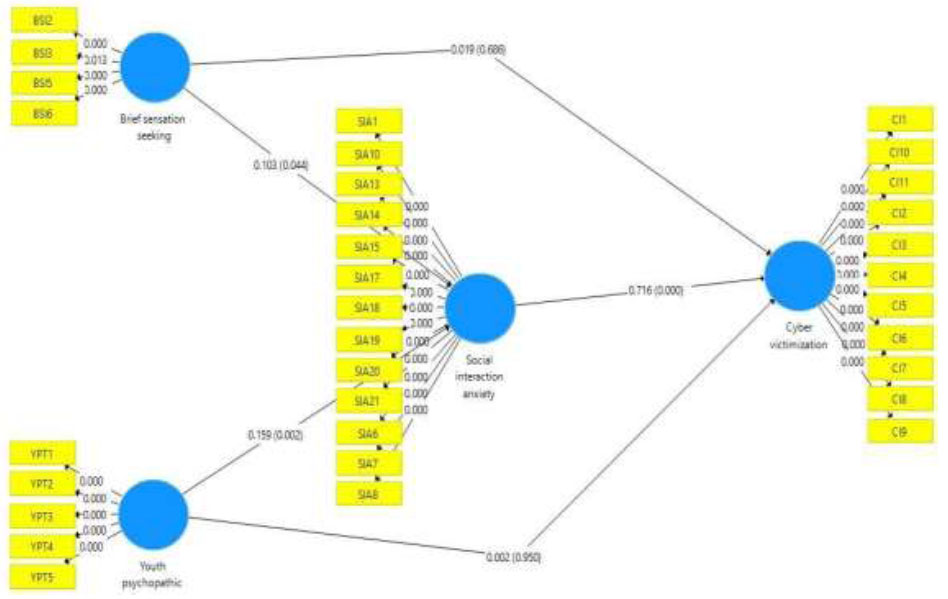
3.7. Hypothesis Testing
In the context of this study, seven hypotheses were rigorously tested, constituting a pivotal phase in the research process. The presentation of significant tests, graphically depicted in Fig. (1) and elaborated in detail in Table 7, offers a transparent and comprehensive overview of the hypothesis testing outcomes.
| - | Brief Sensation Seeking | Cybervictimization | Social Interaction Anxiety | Youth Psychopatic |
|---|---|---|---|---|
| Brief Sensation Seeking | 0.69 | - | - | - |
| Cybervictimization | 0.14 | 0.91 | - | - |
| Social Interaction anxiety | 0.16 | 0.72 | 0.74 | - |
| Youth Psychopatic | 0.36 | 0.15 | 0.20 | 0.74 |
| - | Original Sample (O) | Sample Mean (M) | Standard Deviation (STDEV) | T Statistics (|O/STDEV|) | P-Values |
|---|---|---|---|---|---|
| Brief Sensation Seeking -> Cyberbullying inventory | 0.019 | 0.027 | 0.045 | 0.425 | 0.671 |
| Brief Sensation Seeking -> Social Interaction anxiety | 0.103 | 0.118 | 0.050 | 2.052 | 0.041 |
| Social Interaction anxiety -> Cyberbullying inventory | 0.716 | 0.716 | 0.019 | 37.372 | 0.000 |
| Youth Psychopathic Inventory -> Cyberbullying Inventory | 0.002 | 0.003 | 0.036 | 0.065 | 0.948 |
| Youth Psychopathic Inventory -> Social Interaction Anxiety | 0.159 | 0.165 | 0.050 | 3.184 | 0.002 |
| Brief Sensation Seeking -> Social Interaction Anxiety -> Cyberbullying Inventory |
0.074 | 0.084 | 0.036 | 2.054 | 0.040 |
| Youth Psychopatic Inventory -> Social Interaction Anxiety -> Cyberbullying Inventory | 0.114 | 0.118 | 0.036 | 3.156 | 0.002 |
Path analysis.
The significance testing process involves scrutinizing the statistical outcomes derived from the collected data against predetermined criteria, often guided by estab- lished thresholds for statistical significance. These tests not only validate or refute the formulated hypotheses but also contribute to the broader understanding of how various factors interrelate within the proposed model.
Through a meticulous examination of these signi- ficance tests, researchers gain insights into the strength and directionality of the relationships postulated in the theoretical framework. The outcomes of these tests act as a compass, guiding researchers toward a nuanced interpretation of the empirical findings and their alignment with the underlying theoretical constructs.
3.7.1. Hypothesis 1
Brief sensation-seeking positively affects cyber victimization: standard deviation (STDEV): 0.045, T-statistic: 0.425, P-value: 0.671. No significant evidence indicates that Brief Sensation Seeking positively affects cybervictimization (p > 0.05).
3.7.2. Hypothesis 2
Youth psychopathy positively affects cyber victimization—standard deviation (STDEV): 0.036; T-statistic: 0.065; P-value: 0.948. There is no significant evidence indicating that Youth Psychopathic has a positive effect on cyber victimization (p > 0.05).
3.7.3. Hypothesis 3
Social interaction anxiety has a positive effect on cyber victimization. Standard deviation (STDEV): 0.019; T-statistic 37.372; P-value: 0.000. There is significant evidence indicating that Social Interaction Anxiety has a positive effect on cyber victimization (p < 0.05).
3.7.4. Hypothesis 4
Brief Sensation Seeking positively affects Social Interaction Anxiety—standard deviation (STDEV): 0.050; T-statistic = 2.052; P-value: 0.041. There is significant evidence indicating that Brief sensation-seeking has a positive effect on Social Interaction Anxiety (p < 0.05).
3.7.5. Hypothesis 5
Youth psychopathic affects Social Interaction Anxiety—standard deviation (STDEV): 0.050; T-statistic: 3.184; P-value: 0.002. There is significant evidence indicating that Youth Psychopathic has a positive effect on Social Interaction Anxiety (p < 0.05).
3.7.6. Hypothesis 6
Social Interaction Anxiety significantly mediates the relationship between Brief sensation-seeking and cyber victimization. Standard deviation: 0.036; T Statistics = 2.054; P-Values = 0.040. Brief Sensation Seeking has a significant influence on Cyberbullying inventory with the mediator Social Interaction Anxiety (P < 0.05).
3.7.7. Hypothesis 7
Social Interaction Anxiety significantly mediates the relationship between Youth Psychopathic and cyber victimization. Standard deviation: 0.036; T Statistics = 3.156; P-Values = 0.002. There is a significant influence of the Youth Psychopathic Inventory on Cyberbullying inventory with the mediator Social Interaction anxiety (P < 0.05).
Therefore, based on the statistical tests provided, it can be concluded that the first and second hypotheses cannot be accepted because no significant evidence indicates a positive influence between Brief Sensation Seeking and Youth psychopathology on cyber victimi- zation. The third hypothesis can be accepted because there is significant evidence indicating a positive influence between Social Interaction Anxiety and Cyber- victimization. The fourth and fifth hypotheses cannot be accepted because there is no significant evidence indicating mediation between Brief Sensation Seeking and Youth Psychopathic cyber victimization through Social Interaction Anxiety. The sixth and seventh hypotheses can be accepted. Both independent variables, Brief Sensation Seeking, and Youth Psychopathic Inventory, have a significant influence on Cyberbullying inventory with the mediator Social Interaction anxiety.
The culmination of statistical analyses and hypothesis testing in this study yields nuanced insights into the complex relationships under examination. The initial two hypotheses, positing a positive influence between Brief Sensation Seeking and Youth Psychopathology on cyber victimization, do not find significant support in the empirical evidence. This implies that the anticipated impact of these factors on cyber victimization is not substantiated by the collected data.
Conversely, the third hypothesis, suggesting a positive influence between Social Interaction Anxiety and Cyber- victimization, is substantiated by significant evidence. This finding indicates that Social Interaction Anxiety plays a discernible role in contributing to cyber victimization, aligning with the expectations outlined in the theoretical framework.
Moving beyond individual factors, the fourth and fifth hypotheses propose mediation between Brief Sensation Seeking and Youth Psychopathic cyber victimization through Social Interaction Anxiety. However, the absence of significant evidence suggests that such mediating effects are not strongly supported by the observed data.
In contrast, the sixth and seventh hypotheses find empirical support, indicating that both independent variables, Brief Sensation Seeking and Youth Psychopathic Inventory, exert a significant influence on the Cyber- bullying inventory. Notably, this influence is mediated by Social Interaction Anxiety, highlighting the intricate interplay between these psychological constructs in the context of cyberbullying.
Furthermore, the unadjusted estimates for the association between social media usage and cyber victimization revealed a significant positive relationship (p < 0.05). After adjusting for potential confounders such as age, gender, and internet usage duration, the confounder-adjusted estimates remained consistent with the unadjusted estimates, indicating a robust association between social media usage and cyber victimization. The precision of these estimates was evaluated using a 95% confidence interval, which further supported the statistical significance of the findings.
In conclusion, the synthesis of these statistical outcomes provides a comprehensive understanding of the relationships posited in the research model. The acceptance or rejection of hypotheses adds granularity to the narrative, allowing researchers to delineate the nuanced dynamics at play and contribute meaningfully to the existing body of knowledge in the field of cyberbullying and psychopathology.
3.8. R-Square
The describe how much variance in the endogenous variable can be explained by a set of exogenous variables. The measure used is R Square. The R Square value depicts exogenous/endogenous variables' overall influence on another variable. Another study [31] states that R Square values of 0.75, 0.50, and 0.25 signify substantive (high), moderate, and weak effects, respectively. Another perspective, as per a study [32], cited in another study [28], suggests that R Square values of 0.67 (high), 0.33 (moderate), and 0.19 (weak) indicate different levels of influence.
In this study, the R Square, which is shown in Table 8, is 0.519, falling into the moderate category. This implies that the model used in this study can explain approximately 51.9% of the variation or variability in the Cyber- victimization variable.
| R | R Square | R Square Adjusted |
|---|---|---|
| Cybervictimization | 0.519 | 0.515 |
3.9. Q -Square
Q-Square illustrates the extent of model prediction accuracy (PLS path model's predictive accuracy). This measure is depicted in Q Square redundancy, which signifies how well the model has predictive relevance. If Q Square is greater than 0, the exogenous variable has predictive relevance to the constructed endogenous variable. According to a study [31], when Q Square values are 0, 0.25, and 0.50, the meaning of Q Square is low, moderate, and high in predictive accuracy.
Regarding cyber victimization, the Q Square is 0.432, falling into the moderate category. This suggests that the exogenous variable has moderate predictive relevance to the endogenous variable.
3.10. F-Square
F-Square illustrates the extent of influence of exogenous/endogenous latent variables on the endogenous variable at the structural level. The interpretation of the F2 effect size in [29, 33] is 0.02 (low), 0.15 (medium), and 0.35 (high). The F value for cyber victimization in this study is = 0.010. Based on the provided F-square table, it can be concluded that brief sensation seeking has a low contribution to the dependent variable cyber victimization (F square = 0.001). This indicates that Brief Sensation Seeking has a limited influence on Cybervictimization in the PLS model; Social Interaction Anxiety has a high contribution to the dependent variable cybervictimization (F square = 1.015), indicating that social interaction anxiety significantly contributes to Cybervictimization in the PLS model; Youth Psychopathic has a low contribution to the dependent variable Cybervictimization (F square = 0.023). Although its contribution is higher than that of Brief Sensation Seeking, the contribution of Youth Psychopathic is still limited. In general, it can be concluded that Social Interaction Anxiety has a significant contribution to the dependent variable Cybervictimization; while Brief Sensation Seeking and Youth psychopathology have lower contributions.
| F-Square | Brief Sensation Seeking | Cybervictimization | Social Interaction Anxiety | Youth Psychopatic |
|---|---|---|---|---|
| Brief Sensation Seeking | - | 0.001 | 0.010 | - |
| Cybervictimization | - | - | - | - |
| Social Interaction anxiety | - | 1.015 | - | - |
| Youth Psychopathic | - | 0.000 | 0.023 | - |
Based on the provided F-square in Table 9, the following conclusions can be drawn: Brief sensation seeking has a low contribution to the dependent variable cyber victimization (F square = 0.001). This indicates that Brief Sensation Seeking has a limited influence on Cybervictimization in the PLS model; Social Interaction Anxiety has a high contribution to the dependent variable cybervictimization (F square = 1.015), indicating that social interaction anxiety significantly contributes to Cybervictimization in the PLS model; Youth Psychopathic has a low contribution to the dependent variable Cybervictimization (F square = 0.023). Although its contribution is higher than that of Brief Sensation Seeking, the contribution of Youth Psychopathic is still limited. In general, it can be concluded that Social Interaction Anxiety has a significant contribution to the dependent variable Cybervictimization; while Brief Sensation Seeking and Youth psychopathology have lower contributions.
3.11. The Goodness of Fit Index (GoF)
GOF describes how well the model performs overall. The Goodness of Fit index (GoF), proposed [34, 35], is an evaluation of the overall model, encompassing both the structural and measurement models. The Goodness of Fit index is presented in Table 10.
| FIT Summary | Saturated Model | Estimated Model |
|---|---|---|
| SRMR | 0.068 | 0.068 |
| d_ULS | 2.596 | 2.596 |
| d_G | 0.845 | 0.845 |
| Chi-Square | 1970.702 | 1970.702 |
| NFI | 0.852 | 0.852 |
SRMR (Standardized Root Mean Square Residual). A low SRMR value indicates that the model fits the data well overall. In this case, both the Saturated Model and the Estimated Model have an SRMR of approximately 0.068, indicating that both have similar levels of fit to the data. _ULS measures the distance between the estimated and fully saturated models. A lower value suggests that the estimated model is closer to the Saturated Model. In this case, the Saturated Model and the Estimated Model have the same d_ULS value of 2.596. d_G measures the distance between the estimated model and the Saturated Model. A lower value indicates that the estimated model is closer to the Saturated Model. In this case, the Saturated Model and the Estimated Model have the same d_G value of 0.845. Chi-square is a statistical measurement to evaluate how well the estimated model fits the data. In this case, the Saturated Model and the Estimated Model have the same Chi-Square value of 1970.702. NFI (Normed Fit Index) measures how well the estimated model fits the data, considering the model's complexity. A higher NFI value indicates a better fit. In this case, both the Saturated Model and the Estimated Model have an NFI of around 0.852, indicating that both have similar levels of fit to the data.
GoF can be assessed through the Standardized Root Mean Square Residual (SRMR), as suggested [36]. SRMR helps examine whether empirical data aligns with the constructed model. SRMR, an abbreviation for standa- rdized root mean square residual, measures the model's fit, which is the difference between the correlation matrix of the data and the estimated model's correlation matrix. An SRMR value below 0.08 indicates a good fit for the model. However, another perspective, as stated [37], suggests that an SRMR below 0.10 is still considered an acceptable fit. The SRMR value in this model is 0.068, indicating that the model fits well with the data.
If the values for the Saturated Model and Estimated Model are the same, the Estimated Model has a fit level similar to the reference or fully saturated model. This is a positive indication that the estimated model can be used for analysis and prediction with adequate accuracy.
3.12. PLS Predict
PLS Predict is a measure of the strength of PLS as a Structural Equation Modeling (SEM) predictor. According to another study [31, 38], more than the prediction R-squared alone is insufficient to assert that a model has good predictive power. Therefore, a new PLS Predict method has been developed to validate that the proposed PLS model possesses predictive power. PLS Predict serves as a form of validation for the predictive strength of the PLS test.
To demonstrate that the results of PLS have good predictive power, it is necessary to compare them with a baseline or naive model, namely the linear regression model (LM). The comparison between models (PLS versus LM) is considered better when observed through the measures of RMSE (Root Mean Squared Error) or MAE (Mean Absolute Error), as well as Q square predictive. PLS Predict results are presented in Table 11.
The black-bolded figures on RMSE & MAE (PLS model) represent values lower than those of the LM model, indicating that the PLS model performs better. Additionally, the Q2_predict values are higher in the PLS-SEM model compared to the LM model.
Suppose the analysis results indicate that the PLS model has higher RMSE or MAE values for all indicators/items measuring the endogenous variable compared to the LM model. In that case, it suggests that the PLS-SEM model lacks predictive strength (low predictive power). Suppose most indicators/items measuring the endogenous variable in the PLS model have lower RMSE or MAE values than those in the LM model. In that case, the PLS model has moderate predictive strength. Suppose all indicators/items measuring the endogenous variable in the PLS model have lower RMSE or MAE values than those in the LM model. In that case, the PLS model has high predictive strength.
| Indikator | Model PLS SEM | Model LM | ||||
|---|---|---|---|---|---|---|
| Q2_predict | RMSE | MAE | Q2_predict | RMSE | MAE | |
| CI1 | -0.001 | 1.313 | 1.214 | -0.008 | 1.318 | 1.214 |
| CI2 | -0.005 | 1.408 | 1.336 | -0.006 | 1.408 | 1.324 |
| CI3 | 0.024 | 1.320 | 1.224 | 0.027 | 1.318 | 1.199 |
| CI4 | 0.015 | 1.364 | 1.266 | 0.011 | 1.366 | 1.259 |
| CI5 | 0.027 | 1.371 | 1.280 | 0.023 | 1.375 | 1.265 |
| CI6 | 0.024 | 1.400 | 1.322 | 0.020 | 1.402 | 1.301 |
| CI7 | 0.030 | 1.384 | 1.300 | 0.029 | 1.384 | 1.281 |
| CI8 | 0.016 | 1.334 | 1.237 | 0.029 | 1.326 | 1.212 |
| CI9 | 0.004 | 1.337 | 1.235 | -0.004 | 1.342 | 1.241 |
| CI10 | 0.004 | 1.315 | 1.217 | -0.006 | 1.321 | 1.225 |
| CI11 | 0.009 | 1.378 | 1.299 | 0.010 | 1.377 | 1.277 |
| SIA1 | 0.019 | 1.147 | 0.939 | -0.006 | 1.161 | 0.947 |
| SIA6 | 0.030 | 1.613 | 1.394 | 0.007 | 1.633 | 1.411 |
| SIA7 | 0.027 | 1.599 | 1.379 | 0.003 | 1.619 | 1.392 |
| SIA8 | 0.036 | 1.451 | 1.223 | 0.022 | 1.462 | 1.222 |
| SIA10 | 0.021 | 1.558 | 1.319 | 0.010 | 1.567 | 1.327 |
| SIA13 | 0.004 | 1.228 | 0.972 | -0.032 | 1.250 | 1.000 |
| SIA14 | -0.004 | 1.334 | 1.115 | -0.028 | 1.350 | 1.129 |
| SIA15 | 0.020 | 1.397 | 1.160 | 0.019 | 1.397 | 1.157 |
| SIA17 | -0.006 | 1.301 | 1.077 | -0.011 | 1.304 | 1.079 |
| SIA18 | 0.027 | 1.428 | 1.199 | -0.002 | 1.449 | 1.217 |
| SIA19 | 0.018 | 1.304 | 1.051 | 0.000 | 1.316 | 1.064 |
| SIA20 | 0.006 | 1.407 | 1.140 | 0.000 | 1.411 | 1.142 |
| SIA21 | -0.005 | 1.337 | 1.073 | -0.011 | 1.341 | 1.086 |
| Number | Research Limitations |
|---|---|
| 1 | Reproducibility. The data used in this study originated from respondents limited to two cities in Indonesia, potentially restricting the reproducibility of the research findings across various geographical and cultural contexts. |
| 2 | Generalizability. The findings of this study may have limitations in their generalizability beyond the student population and may need to fully reflect the experience of cyber victimization among the general public. |
| 3 | Limited Sample. This research exclusively involves students actively using the internet and individuals who have experienced cyber victimization. It may constrain the generalizability of the findings to a population less familiar with internet usage. |
| 4 | Use of PLS 3.0. Although Partial Least Squares (PLS) 3.0 was utilized for data analysis, it is essential to acknowledge that the chosen method has certain limitations, and findings may vary if alternative analytical methods were employed. |
| 5 | Measurement Variables. Several variables, such as brief sensation seeking, youth psychopathy, and social interaction anxiety, were measured using specific instruments, raising concerns about the validity and generalizability of these instruments. |
| 6 | Duration of Data Collection. The limited time for data collection may restrict the depth of analysis, and some factors influencing cyber victimization might have yet to be addressed in this study. |
Overall, the RMSE and MAE values for PLS-SEM are lower than those for the LM model. Overall, most indicators in the PLS model have higher Q2 predictive values than the LM model. Based on the quality testing of the model, the Cybervictim model falls into the medium or moderate category. This means that the model is reasonably practical in predicting cyber victimization.
4. DISCUSSION
The obtained data indicate that brief sensation-seeking does not directly influence the level of cyber victimization. Individuals with high levels of brief sensation-seeking tend to have a lower risk of becoming cyber victims. Several factors, such as social skills and practical problem-solving abilities, contribute to this phenomenon. Individuals classified as brief sensation seekers typically possess good social skills [39] and are less prone to becoming cyber victims [40, 41]. Those with good social skills are more likely to identify potentially risky online situations or conflicts, enabling them to proactively avoid or handle such situations wisely. These social skills facilitate establishing healthy, supportive relationships with others online, reducing the risk of cyber victimization.
Nevertheless, brief sensation-seeking does influence cyber victimization through the mediator of social interaction anxiety. Brief sensation-seeking affects the likelihood of experiencing cyber victimization, but this influence does not occur directly; instead, it operates through the intermediary role of social interaction anxiety. Individuals seeking brief sensation experiences may experience anxiety when interacting with others socially [42, 43]. This social anxiety arises from their desire to seek new sensations and engage in challenging or risky situations, ultimately influencing their behavior in the online world, including how they interact and communi- cate online. Anxiety can impact an individual's thoughts and emotions, altering their perception of situations and decision-making abilities, leading to a reduced capacity for rational decision-making that may result in cyber victimization [44].
Psychopathy tendencies also have a direct influence on the level of cyber victimization. It indicates that individuals with psychopathic traits are more likely to engage in cyberbullying behavior or be at risk of becoming victims [45]. The impact of psychopathy tendencies on cyber victimization can be explained by several behavioral characteristics, including a reluctance to adhere to social norms, a lack of empathy, and antisocial behavior patterns. Individuals with high levels of psychopathy are less likely to consider the feelings or needs of others in online interactions, leading to actions that may trigger or escalate the risk of cyber victimization. Antisocial behavior patterns indicate repetitive behaviors, such as acting aggressively online, threatening, or insulting, which increases the risk of cyber victimization. Impulsive behavior is characterized by actions that do not consider the consequences, directing them toward actions that violate social norms, ultimately leading to condemnation from netizens and making them vulnerable to cyber victimization.
Despite individuals with psychopathic tendencies appearing to lack anxiety, this research shows that psychopathy also influences cyber victimization through the mediator of social interaction anxiety. It suggests that individuals with psychopathic tendencies also experience anxiety [46]. Individuals with high levels of psychopathy experience higher levels of anxiety when facing social situations or interacting with others due to their inability to read and respond to others' emotions accurately. Difficulty predicting or interpreting others' emotional responses can lead to confusion or uncertainty during interactions. It can result in specific behaviors in the online environment that increase their risk of becoming cyber victims. For example, their difficulty reading others' emotions may lead them to respond to online situations inappropriately or insensitively, causing conflict or tension with others online. Moreover, the perceived confusion or uncertainty in social interactions can make them more vulnerable to negative influences or pressure from others, increasing their risk of becoming targets of cyberbullying behavior. Therefore, the inability to understand and respond to others' emotions accurately can influence how individuals with psychopathic tendencies behave online, subsequently increasing their risk of experiencing cyber victimization. However, it is important to acknowledge certain limitations in our study. The limitations in this research include reproducibility, generalizability, a limited sample, the use of PLS 3.0, measurement variables, and the duration of data collection, as outlined in Table 12.
In considering the limitations outlined in Table 12, it is evident that the study's reproducibility may be constrained by the exclusive focus on respondents from two cities in Indonesia. Generalizability is also limited to the student population, potentially hindering a comprehensive understanding of cyber victimization across diverse demographic groups. PLS 3.0, while employed for data analysis, comes with acknowledged limitations, and alternative methods might yield different findings. The exclusive inclusion of students and the measurement of variables using specific instruments raise concerns about the broader applicability and validity of the results. Moreover, the duration of data collection may have limitations in comprehensively addressing all factors influencing cyber victimization. These limitations should be considered when interpreting the study's conclusions. These limitations emphasize the need for caution in generalizing the findings beyond the studied context and suggest potential avenues for future research, including a more diverse participant pool and exploring alternative analytical methods to strengthen the robustness of conclusions drawn from this work.
CONCLUSION
In conclusion, the findings from this discussion unravel intricate dynamics surrounding brief sensation-seeking, psychopathy tendencies, and their respective influences on cyber victimization, shedding light on nuanced pathways and mitigating factors within the online realm. The initial revelation that brief sensation-seeking, in isolation, does not directly correlate with higher levels of cyber victimization challenges conventional assumptions. Contrary to expectations, individuals with elevated levels of brief sensation-seeking exhibit a lower risk of falling prey to cyber victimization. This unexpected outcome is attributed to the positive influence of social skills and practical problem-solving abilities inherent in those classified as brief sensation seekers. Their adept social skills enable them to navigate online environments wisely, identifying and circumventing potential risks, thereby reducing the likelihood of cyber victimization.
However, the complexity deepens as the mediating role of social interaction anxiety comes into play. Brief sensation-seeking does influence cyber victimization, but this influence is not direct; rather, it operates through the intermediary mechanism of social interaction anxiety. Individuals seeking brief sensation experiences may grapple with social anxiety, impacting their online behavior and decision-making processes. This anxiety, stemming from their quest for novel experiences and engagement in challenging situations, alters perceptions and decision-making capacities, potentially leading to cyber victimization.
Moving to psychopathy tendencies, the study under- scores a direct correlation between psychopathic traits and an increased likelihood of cyber victimization. This aligns with behavioral characteristics associated with psychopathy, including a disregard for social norms, a lack of empathy, and antisocial behavior patterns. Individuals with psychopathy tend to engage in actions that heighten the risk of cyber victimization, such as aggressive online behavior, threats, and insults.
Surprisingly, the seemingly contradictory notion that individuals with psychopathic tendencies, known for their lack of anxiety, also experience social interaction anxiety is unveiled. This suggests that despite their apparent emotional detachment, individuals with psychopathy may grapple with heightened anxiety during social inter- actions, particularly in online settings. Their inability to accurately interpret others' emotions can lead to inappropriate responses, escalating the risk of cyber victimization.
This comprehensive examination elucidates the multifaceted interplay between psychological traits, anxiety, and online behavior, offering valuable insights for understanding and addressing cyber victimization. The intricate web of factors, including social skills, anxiety, and psychopathic tendencies, underscores the need for a holistic approach to online safety and the development of targeted interventions to mitigate the risks faced by diverse individuals in the digital landscape.
AUTHOR'S CONTRIBUTION
The authors confirm their contribution to the paper as follows: data collection was performed by LN and WR, study concept or design were contributed by TF, YA was involved in the data analysis or interpretation and SN wrote the paper. All authors reviewed the results and approved the final version of the manuscript.
LIST OF ABBREVIATIONS
| SMS | = Short Message Services |
| PLS | = Partial Least Squares |
| Gof | = Goodness of Fit |
| SRMR | = Standardized Root Mean Square Residual |
| HTMT | = Heterotrait Monotrait |
ETHICS APPROVAL AND CONSENT TO PARTICIPATE
This study involved human participants who filled out the research questionnaire. No treatment or placebo effect was administered to the respondents. The research approval was obtained from the Ethics Review Committee of the Faculty of Psychology, Universitas Islam Riau, Indonesia with reference number ERC-2023/A-65.
HUMAN AND ANIMAL RIGHTS
All procedures performed in studies involving human participants were in accordance with the ethical standards of institutional and/or research committee and with the 1975 Declaration of Helsinki, as revised in 2013.
CONSENT FOR PUBLICATION
Written informed consent was obtained from all participants included in this study for the publication of their data.
AVAILABILITY OF DATA AND MATERIAL
The research data was obtained from respondents who completed the research scale. The data is stored as part of the research archives.