All published articles of this journal are available on ScienceDirect.

Adapting the Psychological Capital Questionnaire (PCQ) for Kazakh-Speaking University Students in Kazakhstan: Translation, Validation, and a Three-Factor Model
 iD
Bakyt Arinova2
iD
Dariya Sheveleva1
iD
Zhumakul Molbassynova1
iD
iD
Bakyt Arinova2
iD
Dariya Sheveleva1
iD
Zhumakul Molbassynova1
iD
Authors Info & Affiliations
Abstract
Introduction
Psychological capital is a positive psychological state that helps a person cope with difficulties, maintain optimism, and look to the future with confidence. Developing psychological capital can improve an individual’s mental health and overall well-being.
Objective
To translate, culturally adapt, and psychometrically validate the Psychological Capital Questionnaire (“PsyCap-24”) developed by Luthans, Youssef, and Avolio (2007) into Kazakh for use in the context of Kazakhstan, and to determine the level of psychological capital among university students in the country.
Methods
The procedure complied with international standards and included independent translations, expert evaluation, and pilot testing. Psychometric testing was performed on a sample of 656 individuals (N=656) aged 16 to 27 years (M=18.5; SD=1.22). Exploratory and confirmatory factor analysis methods were used (EFA: n=456; CFA: n=200).
Results
The cultural adaptation of the questionnaire enabled the assessment of psychological capital among Kazakhstani students and resulted in the development of a Kazakh-language version of the instrument. The questionnaire consists of three scales: Self-efficacy, Resilience, and Hope. The validated scales demonstrated high internal consistency. Cronbach’s alpha (α) and McDonald’s omega (ω) reliability coefficients ranged from 0.894 to 0.908. The confirmatory factor analysis (CFA) showed high model fit indices, indicating good structural validity of the instrument.
Discussion
The empirical findings of the present study indicate that optimism items in the Kazakh sample functionally converge with components of resilience and hope. Optimism often shows weaker discriminant validity, and its items may load onto other factors in Asian, Middle Eastern, and post-Soviet samples.
Conclusion
The final model is a three-factor model. The adapted version of the Psychological Capital Questionnaire, along with its subscales (Self-efficacy, Resilience, and Hope), can be used in research, diagnostics, and educational initiatives in Kazakhstan.
1. INTRODUCTION
Psychological resilience, mental health, and productivity in today’s dynamic digital environment are closely associated with the concept of psychological capital (PsyCap). This term was introduced by Luthans et al., who defined it as a positive psychological state comprising confidence or self-efficacy, optimism or a positive attitude, hope, and personal resilience [1]. In the study by Maralov et al., PsyCap is considered part of a triad that includes human, economic, and social capital [2]. Dayneko and Stroh examine PsyCap within the framework of positive organizational behaviour and positive psychology, analysing the influence of life-meaning orientations and PsyCap on organizational behaviour [3].
According to the MindGarden website, the PCQ has been translated into 46 languages worldwide [4]. Numerous researchers have examined the procedures for validating and adapting the questionnaire. These include studies by Djourova et al. in Spain [5], Sapyaprapa et al. in Thailand [6], and Gorgens-Ekermans and Herbert in South Africa [7]. The shortened version of the questionnaire (PCQ-12) was examined by Kamei et al. [8], while the original PCQ-24 has been studied by Cid et al. in Brazil [9], Alkahtani et al. in Saudi Arabia [10], and Datu and Valdez in the Philippines [11].
Olanrewaju and Tinuke (2022) investigate how psychological capital relates to the quality of life among secondary-school teachers. The findings demonstrate clear associations between hope, resilience, and overall well-being. The authors suggest that psychological capital can enhance quality of life, highlighting the importance of adapting the PCQ for diverse groups of students in school and university settings [12].
In Kazakhstan, the development and validation of diagnostic instruments remain highly relevant. This is partly due to the country’s relatively recent independence (34 years ago) and the historical reliance on assessment tools adapted from Russian-language instruments. At present, a new generation of citizens has emerged with limited proficiency in the Russian language. During the Soviet period, higher education in the republic was delivered predominantly in Russian, meaning that virtually all students were proficient in the language [13]. In contrast, the linguistic landscape of higher education in the twenty-first century has changed considerably, with the majority of students now receiving their education primarily in Kazakh. According to the National Bureau of Statistics of Kazakhstan, “65.6% of students receive their education in Kazakh, 24.8% in Russian, and the remaining 9.6% in foreign languages [14]. Furthermore, Kazakhstan’s contemporary language policy seeks to strengthen a new national identity among its citizens [15]. Therefore, the validation of psychological instruments in the Kazakh language is particularly important.
As noted by Aimagambetova and Sarieva, the number of validated assessment tools available in the Kazakh language remains insufficient for Kazakhstani society [16]. Successfully validated instruments in the Kazakh language include the Inventory of Depressive Symptoms (IDS) [17], the Schwartz Value Survey [18], the Mental Health Continuum - Short Form [19], the Depression Anxiety Stress Scale (DASS-21) [20], and the Fisher Divorce Adjustment Scale [21].
The aim of this study was to adapt the PCQ-24 developed by Luthans et al. [1] for a Kazakh-speaking sample by translating the instrument into the Kazakh language and evaluating its psychometric properties, including internal consistency, convergent validity, and test–retest reliability.
2. RESEARCH DESIGN AND METHODS
2.1. Procedure and Research Methods
The research design was reviewed and approved by the Ethics Committee of Al-Farabi Kazakh National University in 2025 (Protocol No. IRB-A1667, Registration No. 119). Data collection was conducted online from February 20 to April 11, 2025, using the Google Forms platform. The questionnaire was distributed via convenience sampling through digital channels, primarily WhatsApp and Instagram. Participants were allowed to share the survey link with their acquaintances, which partially corresponded to the principles of snowball sampling, a typical feature of online research.
Participation in the survey was voluntary and anonymous. Before completing the questionnaire, participants were provided with an information sheet describing the study objectives, guarantees of confidentiality, the estimated completion time (12–25 minutes), and the voluntary nature of participation. The questionnaire also contained the contact details of the research team. Each participant was able to complete the survey only once, ensuring the uniqueness and reliability of the collected data. Inclusion criteria required participants to be aged 17 years or older and to have adequate proficiency in the Kazakh language. The study involved students from Al-Farabi Kazakh National University, Abai Kazakh National Pedagogical University, Ahmet Yassawi University, and Alikhan Bokeikhan University. Participation was entirely voluntary, and no incentives or rewards were offered.
2.2. Sample Division and Justification of Sample Size
The sample size for validating the Kazakh version of the questionnaire was determined in accordance with international recommendations for factor analysis (Floyd & Widaman, 1995; Fokkema & Greiff, 2017) [22, 23]. According to these sources, the minimum ratio ranges from 5:1 to 10:1 (participants per estimated parameter). In the present study, a ratio of at least 10:1 was maintained, ensuring the statistical reliability and validity of the results. The total sample for the adaptation and translation of the English version of the Psychological Capital Questionnaire consisted of 656 participants (N = 656), including 570 females and 86 males aged 16 to 27 years (М = 18.5; SD = 1.22). This sample was randomly divided into two subsamples: N = 456 for conducting the Exploratory Factor Analysis (EFA) and N = 200 for the Confirmatory Factor Analysis (CFA).
Prior to the translation and adaptation of the methodology, we received written permission from one of the authors of the original 24-item PsyCap questionnaire, Professor F. Luthans, to translate, culturally adapt, and use the PsyCap-24 questionnaire as part of a grant-funded research project (IRN AR23488243 “Development of Psychodiagnostics in Education in Kazakhstan and Worldwide: Cross-Cultural Analysis and Development of a Validation Algorithm”). The original PCQ-24 instrument consists of 24 items designed to assess four core personal characteristics. These include self-efficacy, which reflects confidence in achieving goals and solving tasks; hope, understood as the ability to redirect pathways toward goal attainment; optimism, defined as a positive outlook on success; and resilience, which refers to the capacity to cope with difficulties. The questionnaire consists of 21 positively worded statements and 3 reverse-worded items. Students are asked to rate the extent to which each statement reflects their personal characteristics using a 6-point Likert scale from 1 (“strongly disagree”) to 6 (“strongly agree”).
The translation and cultural adaptation of the PCQ-24 into Kazakh was carried out in accordance with international guidelines and standards proposed by Sousa and Rojjanasrirat [24], Sperber [25], and the ITC Guidelines for Translating and Adapting Tests [26].
The first step involved translating the English version of the questionnaire into Kazakh by two independent professional translators. In the second step, a third translator, who was both bilingual and bicultural, compared the two versions and merged them into a single preliminary Kazakh version of the questionnaire. The third step involved back-translation, in which another translator translated the preliminary Kazakh version back into English. In the fourth step, a multidisciplinary committee was established, consisting of a bilingual practicing psychologist who was part of the research team, a native Kazakh-speaking researcher, and two translators who had previously been involved in translating the questionnaire. The committee carefully compared and evaluated the back-translated version against the original English questionnaire. All discrepancies were discussed, reviewed, and corrected.
After completing all procedures for translating and semantically aligning the concepts, we asked another Kazakh-English bilingual with a degree in philology to compare the final Kazakh version with the original English questionnaire. The translated version was assessed as accurate and appropriate.
The fifth step involved pilot-testing the Kazakh-language version of the questionnaire with a sample of 30 participants. This phase focused on evaluating face validity, particularly the clarity and cultural relevance of the questionnaire items. This was conducted with bilingual Kazakh-English students, which enabled us to identify any ambiguous or culturally inappropriate wording in the statements. Participants completed the translated Kazakh version of the scale and provided written comments on each item. Based on the feedback received, targeted editorial revisions were made to improve the linguistic accuracy and cultural appropriateness of the items. Students were also asked to evaluate the clarity and comprehensibility of all questions. Following this stage, the final Kazakh version of the PsyCap questionnaire, consisting of 24 items, was approved.
3. RESULTS
3.1. Primary Data Processing
All questionnaires were administered to participants in paper-based format. After completion, an initial screening of the responses was conducted, during which questionnaires with incorrect or incomplete data were excluded from the overall sample. Following this procedure, a total of 708 questionnaires remained. Of these, 52 questionnaires containing two or more missing items were excluded from further analysis. For 11 questionnaires with a single missing response, missing values were replaced using median substitution through the SPSS “Replace Missing Values” function. The dataset was not screened for statistical outliers. Duplicate entries were unlikely, as all questionnaires were completed manually in an offline format. Data-entry accuracy was verified using descriptive statistics, including frequency analyses for each item, which allowed potential input errors (e.g., implausible values such as “66” or “55”) to be identified and corrected.
Before data analysis, the reverse-coded items (item 13, item 20, and item 23) were recoded to ensure a consistent directionality across all scale items. This procedure allowed higher scores on reverse items to correspond to higher levels of the measured construct rather than the opposite. The calculation of total scale scores, internal consistency indices, factor analysis, and reliability and validity assessment was conducted only after the reverse items had been inverted.
In the first stage of the questionnaire adaptation process, EFA was conducted to identify latent factors without considering the structure of the original questionnaire. The sample for the EFA consisted of 456 participants, including 395 women and 61 men, with a mean age of 18.49 years. For exploratory factor analysis (EFA), the principal component analysis (PCA) method was used to identify factors. Varimax rotation with Kaiser normalization was applied as the rotation technique. The number of factors was determined based on eigenvalue analysis (eigenvalues > 1) and inspection of the scree plot generated using SPSS.
This procedure was conducted to identify potential cultural differences in the understanding of the psychological phenomena under study. The obtained Kaiser-Meyer-Olkin (KMO) coefficient was found to be 0.943, indicating a high level of sampling adequacy for factor analysis. The result of Bartlett’s test of sphericity was statistically significant (χ2 (276) = 5522.33, p <0.001), confirming the presence of substantial correlations among the variables.
Based on the EFA results, four latent factors were identified, accounting for 59.29% of the total variance. All 24 items of the questionnaire showed factor loadings > 0.4. After rotation, the contribution of each factor to the total variance was distributed as follows:
Factor 1 (Self-Efficacy) explained 20.75% of the variance;
Factor 2 (Resilience) explained 15.55% of the variance;
Factor 3 (Hope) explained 13.72% of the total variance;
Factor 4 (including the three reverse questions) explained 9.27% of the total variance. The distribution of factor loadings is presented in Table 1.
| Item Number | Factor 1 (Efficacy) | Factor 2 (Resilience) | Factor 3 (Hope) | Factor 4 (theoretically undefined) |
|---|---|---|---|---|
| Item1 | 0.739 | - | - | - |
| Item2 | 0.749 | - | - | - |
| Item3 | 0.684 | - | - | - |
| Item4 | 0.668 | - | - | - |
| Item5 | 0.721 | - | - | - |
| Item6 | 0.759 | - | - | - |
| Item7 | 0.584 | - | 0.403 | - |
| Item9 | 0.589 | - | - | - |
| Item14 | - | 0.443 | - | - |
| Item15 | - | 0.599 | - | - |
| Item16 | - | 0.448 | - | - |
| Item17 | - | 0.646 | - | - |
| Item18 | - | 0.581 | - | - |
| Item19 | - | 0.535 | - | - |
| Item21 | 0.446 | 0.423 | - | - |
| Item22 | - | 0.542 | - | - |
| Item24 | - | 0.755 | - | - |
| Item8 | - | - | 0.572 | - |
| Item10 | - | - | 0.803 | - |
| Item11 | - | - | 0.744 | - |
| Item12 | - | - | 0.793 | - |
| Item13 | - | - | - | -0.829 |
| Item20 | - | - | - | -0.590 |
| Item23 | - | - | - | -0.793 |
Thus, the EFA confirmed the presence of structural changes in the questionnaire. The original version of the questionnaire included four scales: efficacy, resilience, hope, and optimism. The EFA results showed that the items from the optimism scale were redistributed to the resilience scale. In our opinion, this redistribution can be considered theoretically justified. As shown in Table 1, two items (items 7 and 21) demonstrated cross-loadings, while three items (items 13, 20, and 23) showed negative loadings on an additional fourth factor. These results can be explained theoretically, as these items are reverse-worded and reflect opposite meanings. This factor does not represent an independent factor and will not be considered in further research.
The evaluation of the EFA results was conducted by relying on the original theoretical model. Thus, it was decided to include item 7 in Factor 3 (Hope), as this item originally belonged to this scale. The structure of the questionnaire was organized as follows:
Factor 1 (Efficacy): 1, 2, 3, 4, 5, 6, 9, 21
Factor 2 (Resilience): 14, 15, 16, 17, 18, 19, 22, 24
Factor 3 (Hope): 7, 8, 10, 11, 12
Factor 4 (Undefined): 13, 20, 23
Verification of the factor structure: CFA was conducted to assess the consistency of the obtained data with the original scale structure of the PCQ-24. For the second phase of the study, a new group of students who had not participated in the initial EFA was recruited. Conducting CFA on a new sample allowed us to avoid the risk of capitalizing on chance and exclude the likelihood of overfitting the model to the random features of a particular sample. The confirmatory factor analysis was performed on a sample of 200 participants, including 174 women and 26 men, with a mean age of 18.52 years.
The Lilliefors-corrected Kolmogorov-Smirnov test and the Shapiro-Wilk test were conducted to evaluate the normality of the data. Normality tests were conducted separately for each scale (efficacy, resilience, and hope), and the results are presented in Table 2.
|
Scales N = 200 |
Lilliefors-corrected Kolmogorov-Smirnov test | Shapiro-Wilk Test |
|---|---|---|
| Efficacy | 0.091, p < 0.001 | 0.935 p < 0.001 |
| Resilience | 0.085, p < 0.001 | 0.985 p = 0.029 |
| Hope | 0.089, p < 0.001 | 0.955 p < 0.001 |
Table 2 shows that non-normality of distribution was recorded for all three scales, as indicated by both the Kolmogorov-Smirnov test with Lilliefors correction and the Shapiro-Wilk test.
To further test and refine the model, CFA was conducted using the Diagonally Weighted Least Squares (DWLS) method. This method is considered more appropriate when working with ordinal data, such as the Likert scale. It provides more reliable estimates of model parameters when the data distribution deviates from normality.
The obtained modification indices enabled an improved model structure and the redistribution of items from factor 4. Items 21 and 22 were reallocated to factor 2 and factor 3, respectively. Items from factor 4 were reallocated to factor 2. Thus factor 1 (Efficacy) includes items 1, 2, 3, 4, 5, 6, 9 (7 questions); factor 2 (Resilience): 14, 15, 16, 17, 18, 19, 21, 24, 13, 20, 23 (11 questions); factor 3 (Hope): 7, 8, 10, 11, 12, 22 (6 questions). The final structure of the questionnaire is presented in Fig. (1).
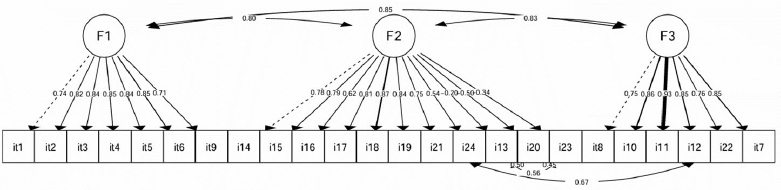
Factor structure of the Kazakh version of the PCQ-24.
As shown in Figure 1, the inter-factor correlations range from 0.80 to 0.85, indicating a significant relationship between the latent variables, while still allowing them to be considered separate constructs. All questionnaire items have high factor loadings, indicating that these items are highly representative of the factors they identify. The exceptions include items 13, 20, and 23, which are reverse items. Given this circumstance, we consider it acceptable that their loadings are in the range of 0.2 to 0.5.
CFA was applied to test the adequacy of the identified model. For the confirmatory factor analysis (CFA), the R software environment (version 4.4.3) was used with the lavaan package (version 0.6-19). The model was estimated using the diagonally weighted least squares (DWLS) estimator and the NLMINB optimization method. Model fit was assessed using the following fit indices: χ2, Comparative Fit Index (CFI), Tucker-Lewis Index (TLI), Root Mean Square Error of Approximation (RMSEA), and Standardized Root Mean Square Residual (SRMR). The criteria for acceptable model fit were defined as CFI and TLI ≥ 0.90, RMSEA ≤ 0.08 and SRMR ≤ 0.08 [27]. The fit indices of the final model are presented in Table 3.
As shown in Table 3, the CFI and TLI > 0.95, indicating excellent model fit. The RMSEA and SRMR < 0.08, suggesting an acceptable model fit. Thus, the data obtained indicate a sufficiently good fit of the model to the data. Due to high inter-factor correlations (≈ 0.80-0.85), alternative models were tested to examine a potentially better-fitting structure. In particular, a bifactor model was evaluated, including a general factor and group-specific factors. However, compared with the model presented above, the bifactor model demonstrated substantially weaker fit indices; therefore, its results were not included in the article.
| Indices | Obtained Values | Statistical Standards |
|---|---|---|
| CFI | 0.994 | CFI/ TLI > 0.95 – Excellent CFI/ TLI > 0.90 - Acceptable RMSEA/ SRMR < 0.05 - Excellent RMSEA/ SRMR < 0.08 - Acceptable |
| TLI | 0.993 | |
| RMSEA | 0.072 | |
| SRMR | 0.061 | |
| 90% CI [0.063, 0.081] | ||
| Model fit evaluation | (÷2) - 495.493 Degrees of freedom (df) - 245 p < 0.001 ÷2/df = 495,493/245 = 2,02 (values below 3 indicate an acceptable model fit) Local model fit was assessed using standardised residuals and modification indices. |
|
After administering the Kazakh-language version of the questionnaire to the students and collecting the data, we determined the internal consistency of the methodology. To assess the internal consistency of all three scales, two reliability measures, Cronbach's alpha coefficient (α) and McDonald's omega coefficient (ω), were calculated, and these showed acceptable internal reliability. The Cronbach's (α) and McDonald's (ω) reliability coefficients ranged from 0.894 to 0.908. According to accepted psychometric standards, values above 0.80 indicate high coherence and values above 0.70 indicate satisfactory coherence. The internal reliability measures are reflected in Table 4.
| Scale | Cronbach's Alpha | McDonald's Omega |
|---|---|---|
| Efficacy - 7 items | 0.894 | 0.896 |
| Resilience - 11 items | 0.628 - with reverse items (13, 20, 23) 0.875 - without reverse items |
0.876 - without reverse items |
| Hope - 6 items | 0.905 | 0.908 |
As shown in Table 4, all scales show high internal consistency. The “Resilience” scale, which includes reverse-coded items, demonstrated a relatively low Cronbach’s alpha (α = 0.628). However, when reliability was re-examined with these items removed, the alpha coefficient increased substantially (α = 0.875), indicating strong internal consistency among the direct items of the scale. These findings may suggest potential issues with the wording of the reverse-coded items. To further examine this assumption, item-total correlations and Cronbach’s alpha values after item deletion were analyzed (Table 5).
| - | Corrected Item–Total Correlation | Cronbach’s Alpha if Item Deleted |
|---|---|---|
| Item14 | 0.563 | 0.549 |
| Item15 | 0.558 | 0.553 |
| Item16 | 0.349 | 0.592 |
| Item17 | 0.614 | 0.539 |
| Item18 | 0.638 | 0.535 |
| Item19 | 0.612 | 0.543 |
| Item21 | 0.478 | 0.568 |
| Item24 | 0.254 | 0.612 |
| Item13 | -0.032 | 0.678 |
| Item20 | -0.266 | 0.709 |
| Item23 | -0.160 | 0.701 |
As shown in Table 5, the three reverse-coded items demonstrate negative correlations with the overall scale. Cronbach’s alpha increases when these items are removed from the scale structure, suggesting that the issue lies specifically with these items and, potentially, with their wording.
The inter-item correlation matrix (Table 6) showed that the reverse-coded items were negatively correlated with the remaining items of the scale.
Thus, the issue may lie within the items themselves, which requires further examination and clarification in future studies.
| - | Item14 | Item15 | Item16 | Item17 | Item18 | Item19 | Item21 | Item24 | Item13 | Item20 | Item23 |
|---|---|---|---|---|---|---|---|---|---|---|---|
| Item14 | 1.000 | 0.592 | 0.336 | 0.562 | 0.553 | 0.486 | 0.420 | 0.366 | -0.198 | -0.243 | -0.111 |
| Item15 | 0.592 | 1.000 | 0.404 | 0.592 | 0.549 | 0.535 | 0.365 | 0.325 | -0.083 | -0.366 | -0.184 |
| Item16 | 0.336 | 0.404 | 1.000 | 0.553 | 0.493 | 0.440 | 0.369 | 0.213 | -0.281 | -0.337 | -0.289 |
| Item17 | 0.562 | 0.592 | 0.553 | 1.000 | 0.730 | 0.599 | 0.496 | 0.278 | -0.166 | -0.364 | -0.272 |
| Item18 | 0.553 | 0.549 | 0.493 | 0.730 | 1.000 | 0.676 | 0.553 | 0.298 | -0.153 | -0.334 | -0.262 |
| Item19 | 0.486 | 0.535 | 0.440 | 0.599 | 0.676 | 1.000 | 0.600 | 0.311 | -0.094 | -0.378 | -0.207 |
| Item21 | 0.420 | 0.365 | 0.369 | 0.496 | 0.553 | 0.600 | 1.000 | 0.425 | -0.099 | -0.366 | -0.337 |
| Item24 | 0.366 | 0.325 | 0.213 | 0.278 | 0.298 | 0.311 | 0.425 | 1.000 | -0.198 | -0.253 | -0.339 |
| Item13 | -0.198 | -0.083 | -0.281 | -0.166 | -0.153 | -0.094 | -0.099 | -0.198 | 1.000 | 0.468 | 0.507 |
| Item20 | -0.243 | -0.366 | -0.337 | -0.364 | -0.334 | -0.378 | -0.366 | -0.253 | 0.468 | 1.000 | 0.480 |
| Item23 | -0.111 | -0.184 | -0.289 | -0.272 | -0.262 | -0.207 | -0.337 | -0.339 | 0.507 | 0.480 | 1.000 |
The process of adapting a psychodiagnostic instrument is similar to the process of creating a new methodology, as the structure of the original questionnaire may undergo significant changes due to cultural influences. Based on the results of exploratory and confirmatory analyses, the structure of the questionnaire was modified (with one of the factors, optimism, excluded). Despite good model fit indices, it is necessary to test the reliability and validity of the final questionnaire to determine how well the instrument fulfills its psychodiagnostic functions.
To assess the reliability of the adapted psychodiagnostic instrument, the test-retest method was used. The sample for reliability testing included 112 individuals (N = 112). The normality of the data distribution was evaluated using the Lilliefors-corrected Kolmogorov-Smirnov test and the Shapiro-Wilk test. The statistical analysis indicated that several scales deviated from a normal distribution. Given these circumstances, Spearman’s rank correlation coefficient was applied to examine the relationship between the variables obtained from the first and second administrations of the questionnaire.
A period of 45 days elapsed between the first and second administration of the questionnaire. It is worth noting that, according to international standards, the interval should be no more than six months and no less than four weeks. The obtained results are shown in Table 7.
| - | Factor 1 (Efficacy) | Factor 2 (Resilience) | Factor 3 (Hope) | Total Score |
|---|---|---|---|---|
| Factor 1 (Efficacy) 95% CI [0.568, 0.841] |
0.721** | - | - | - |
| Factor 2 (Resilience) 95% CI [0.494, 0.770] |
- | 0.654** | - | - |
| Factor 3 (Hope) 95% CI [0.669, 0.843] |
- | - | 0.770** | - |
| Total score 95% CI [0.639, 0.855] |
- | - | - | 0.766** |
Note: **The correlation is significant at the 0.01 level.
Thus, as shown in Table 7, the results of the first and second administrations across all scales, as well as the total score, are significantly correlated, indicating the stability of the measurements and the reliability of the methodology. The results obtained using this methodology are stable over time.
Verification of the convergent validity of the questionnaire. At present, in Kazakhstan, there are no validated instruments available in the Kazakh language to measure the psychological constructs examined in this study. This circumstance complicates the process of assessing the validity of the adapted psychodiagnostic instrument. To address this issue, we selected existing instruments that had previously been adapted for Russian-speaking populations and translated them into Kazakh, allowing bilingual Kazakh participants who are fluent in both Russian and Kazakh to respond to bilingual items. To assess the convergent validity of the psychodiagnostic instrument, the following standardized instruments were selected and translated into Kazakh:
- The self-efficacy test developed by Maddux and Sheer, adapted by Boyarintseva under the supervision of Krichevsky.
- The Russian version of the Brief Resilience Scale, adapted by Alfimova and Golimbet.
- Diagnostics of dispositional optimism: validity and reliability of the Russian Version of LOT-R adapted by Gordeeva et al. [28].
The study sample consisted of 277 participants (N = 277). Before conducting the validity assessment, the obtained data were tested for normality of distribution using the Kolmogorov - Smirnov test with Lilliefors correction and the Shapiro - Wilk test. The results are presented in Table 8.
|
Scales N = 277 |
Kolmogorov - Smirnov Test with Lilliefors correction | Shapiro - Wilk Test |
|---|---|---|
| Efficacy | 0.126, p < 0.001 | 0.903 p < 0.001 |
| Resilience | 0.071, p = 0.002 | 0.992 p = 0. 154 |
| Hope | 0.089, p < 0.001 | 0.948 p < 0.001 |
As shown in Table 8, the efficacy and hope scales have a non-normal distribution, while the resilience scale shows only minor deviations from normality. In this regard, Spearman's rank correlation coefficient was used to analyse the relationship between the PCQ results and the instruments presented above. The obtained results are reflected in Table 9.
| - | The Self-efficacy Test Developed (Maddux and Sheer) | The Russian Version of the Brief Resilience Scale (Alfimova and Golimbet) | Diagnostics of Dispositional Optimism: Validity and Reliability of Russian Version of LOT-R (Gordeeva et al.) [28] |
|---|---|---|---|
| Scale 1 (Efficacy) 95% CI [0.299, 0.495] |
0. 373** | - | - |
| Scale 2 (Resilience) 95% CI [0.363, 0.553] |
- | 0.464** | - |
| Scale 3 (Hope) 95% CI [0.296, 0.498] |
- | - | 0.399** |
Note: **The correlation is significant at the 0.01 level.
As shown in Table 9, there are significant positive correlations between the scales of the developed psychodiagnostic instrument and existing standardized measures, indicating that the presented scales effectively measure the stated construct domains. It is important to note that to assess hope, we used the methodology measuring the level of optimism, as the Kazakh language uses overlapping expressions for the concepts of hope (umіt, meaning “hope”) and optimism (omirge umittene qarau, meaning “to look at life with hope”), which may have common contexts of use. The Kazakh language does not have a direct lexical equivalent for the concept of “optimism.” In international literature, as well as in certain dictionaries and academic sources, optimism is often defined in terms of hope. Optimism (from the Latin optimus, meaning “the best”) is commonly understood as “hope for a positive future and confidence that difficulties will end favourably,” or as “a person’s hopefulness or confidence about the success of something or the future” [29]. In Kazakh cultural understanding, hope (“umit”) is viewed as a core element of a positive worldview [30], closely associated with belief (“senim”), goodness or well-being (“zhaksylyk”), and culturally reinforced through blessings (“bata”).
Optimism can be considered an active form of hope, reflecting not only the expectation of a positive outcome but also confidence in its realization. Hope is often associated with positive expectations of the future and belief in a better future. Optimism, in turn, is a broader concept, encompassing not only positive expectations but also a general outlook on life. These linguistic and cultural differences make it reasonable to use optimism as an indicator of hope, given that optimistic people tend to report higher levels of hope. Cross-cultural research in sociology and cultural studies shows that optimism and hope are key factors in shaping individual and social behaviour. Therefore, the use of optimism to assess hope in the Kazakh context can be justified both theoretically and empirically, given their proximity and interconnection in both lexical and psychological aspects. Theoretical justification for selecting optimism as an indicator for hope can thus serve as a confirmation of the interrelation of these concepts in the studied Kazakh culture and psychology.
The final stage in the adaptation of the PCQ involves the identification of test norms. Table 10 reflects descriptive statistics on the scales.
| Scale | Number of Participants | Min | Max | SD (Standard Deviation) |
|---|---|---|---|---|
| Scale 1 (Efficacy) | 656 | 7 | 42 | 5.83 |
| Scale 2 (Resilience) | 656 | 24 | 66 | 6.02 |
| Scale 3 (Hope) | 656 | 6 | 36 | 5.48 |
Based on the empirical data, percentile ranks were calculated to reflect each respondent’s position within the sample according to their score. To simplify the categorisation of the data obtained by each student, quartile values (25th and 75th percentiles) were calculated, which were then used as starting points for the distribution of scores into low, medium, and high levels. No differences were found between men and women. The test norms are shown in Table 11.
| Scale | Efficacy | Resilience | Hope | Total Score |
|---|---|---|---|---|
| Levels | Scores | Scores | Scores | Scores |
| Low | 7-30 | 22 – 42 | 6-24 | 24-98 |
| Average | 31-39 | 43-50 | 25-31 | 99-119 |
| High | 40-42 | 51-66 | 32-36 | 120–144 |
However, the predominance of female participants in the sample suggests that the findings may not be equally generalizable to both genders, as a clear gender imbalance is present. The overrepresentation of women raises the question of how reliable the questionnaire would be when applied to male participants. This limitation highlights the need for future research to test gender invariance and ensure that the instrument demonstrates comparable reliability for both men and women.
Thus, the Kazakh version of the PCQ appears to deviate structurally from the original four-factor model.
3.2. Psychological Capital Indicators in the Kazakhstani Sample
The students in the sample showed the following results across the three scales of Psychological Capital. On the Self-efficacy scale, the majority of participants (51.75%) demonstrated an average level, reflecting a moderate sense of their own competence and ability to achieve their goals. At the same time, 22.5% of students showed a high level, indicating a strong confidence in their abilities, while 25.75% had a low level of effectiveness, which may indicate doubts about their personal abilities and a tendency to self-deprecation.
On the Resilience scale, an average level also predominated (43.5%), while 30.5% of participants showed high scores, indicating a well-developed ability to overcome difficulties and maintain inner balance. At the same time, 26% of students demonstrated a low level of resilience, which may reflect difficulties in adapting to stressful situations and reduced stress tolerance.
On the Hope scale, 88.25% of participants demonstrated a high level, indicating strong goal orientation, the ability to find ways to achieve objectives, and confidence in a successful future. Only a small proportion of students (1.75%) showed a low level of hope, which can be considered an exception within this sample.
Foreign scholars are conducting studies to identify the connection or influence of psychological capital on life satisfaction [31, 32], depression [33], social support, and work engagement [34]. In future research, we also plan to examine the relationships between psychological capital and the specific features of students’ mental health.
4. DISCUSSION
The findings indicate that the Kazakh version of the Psychological Capital Questionnaire (PCQ) differs structurally from the original four-factor model proposed by Luthans et al. [1]. In the original model, optimism is treated as an independent component alongside self-efficacy, hope, and resilience. However, in the present study, optimism did not emerge as a separate latent factor, which necessitated a reconsideration of the conceptual structure of the model.
It is important to note that this discrepancy should not be interpreted as a methodological limitation or a weakness of the adaptation process. Instead, the identified three-factor structure may reflect a culturally shaped reconceptualization of psychological capital that corresponds to the specific sociocultural context.
From a theoretical perspective, optimism in the Western psychological tradition is conceptualized as a relatively autonomous cognitive–affective trait. It is closely associated with individualistic values, personal control, and expectations of positive outcomes [35]. In collectivist cultures, including the Central Asian context, optimism is less frequently conceptualized as an independent psychological construct. Instead, it tends to be integrated into broader constructs such as resilience, patience, acceptance of circumstances, and reliance on social support.
The empirical findings of the present study indicate that optimism items in the Kazakh sample functionally converge with components of resilience and hope. This pattern suggests a different psychological role for optimism in this context. Rather than functioning as an independent resource, optimism appears as a derivative trait. It reflects the ability to maintain stability in difficult life situations and a belief in positive outcomes mediated by social and cultural norms.
Similar structural transformations of psychological capital have been repeatedly observed in cross-cultural research. For instance, a comparable merging of hope and optimism factors was reported in the South African adaptation [36]. Another example comes from the study by Sandayanti and Harkina [37], which found that self-efficacy is associated with academic resilience among university students. Understanding gender differences in these constructs may help inform the development of counseling programs in higher education aimed at managing stress, enhancing motivation, and supporting academic well-being and resilience.
During the exploratory factor analysis (EFA) of the Psychological Capital scale, items related to optimism and resilience were found to load onto a single common factor or to form closely related subfactor clusters. This structural pattern differed from the original theoretical model, in which these constructs were conceptualized as distinct, though interrelated, components.
Why might this make sense within the Kazakh cultural and research context? A contextual interpretation suggests that in certain cultural settings, including the Kazakh cultural framework and contemporary educational environments, individual and stress-resilience characteristics may manifest synergistically. For instance, striving toward a positive outlook (optimism) may be closely intertwined with confidence in one’s ability to endure difficulties and adapt to stressful situations (resilience). This dynamic can result in strong correlations between the respective scales and the emergence of a shared factor structure.
From an empirical perspective, when the data show substantial overlap in item content and strong correlations between subscales, forcing a separation into distinct factors may fail to reflect the stable construct structure of the sample. In such cases, combining factors may better represent the underlying latent structure of psychological capital within this population.
Several studies have reported restructuring of the PCQ factor structure during cross-cultural adaptation. In particular, optimism often shows weaker discriminant validity, and its items may load onto other factors in Asian, Middle Eastern, and post-Soviet samples. These findings suggest that, although the core idea of psychological capital appears universal, its factor structure may not be fully culturally invariant.
In this regard, the three-factor model identified in the Kazakh version of the PCQ should be interpreted as a culturally adapted operationalization of psychological capital. It reflects a context-specific way in which positive psychological resources are integrated within this sociocultural environment, rather than a deviation from the “standard” model.
Thus, the decision not to retain optimism as a separate factor is both theoretically and empirically justified and aligns with contemporary perspectives on the context-sensitive nature of positive psychological constructs.
The Kazakh version of the Psychological Capital Questionnaire represents a culturally adapted operationalization of the construct, reflecting a different configuration of relationships among positive psychological resources rather than a direct replication of the original Western four-factor model. Nevertheless, the study has several limitations.
5. STUDY LIMITATIONS
The study has several limitations, including a gender imbalance in the sample, which may be partly explained by higher participation rates among females in Kazakhstan compared with males. Similar gender disparities have been reported in previous studies [38, 39]. Sampling and geographical constraints should also be considered when interpreting the findings. The results may therefore be most applicable to students from the participating universities and, potentially, to the female student segment represented in the sample. Accordingly, the findings are interpreted as specific to this cohort and are not generalized to the broader student population of Kazakhstan without further empirical support.
This version of the questionnaire is intended primarily for use within Kazakhstan. The adapted Kazakh-language scale reflects the linguistic, cultural, and sociolinguistic features of the country’s Kazakh-speaking population. Its use outside Kazakhstan would require additional validation to confirm cultural relevance. The study did not examine measurement invariance across gender, age, or other demographic variables. This limits the interpretation of potential group differences. Future research should continue data collection and explore the influence of gender and age on psychological capital.
Considering the Kazakh cultural context and the specific features of the educational environment, the merging of these two dimensions may reveal the underlying latent structure of psychological capital among the participants. However, this interpretation remains context-bound, as optimism and resilience may function as distinct constructs in other populations. Therefore, further studies with broader samples and confirmatory analyses are needed to support generalizability.
The Kazakh version represents a culturally adapted operationalization of PsyCap rather than a direct replication of the original Western model.
CONCLUSION
The aim of the present study was to adapt the Psychological Capital Questionnaire (PCQ-24) for a Kazakh-speaking sample. The processing and interpretation of the test results obtained from 656 students showed sufficient internal consistency of the instrument, with all scales demonstrating acceptable values of Cronbach’s alpha (α) and McDonald’s omega (ω) reliability coefficients.
As a result of the analysis, a three-factor structure of the questionnaire was identified. In the first stage, an exploratory factor analysis (EFA) was conducted to explore potential structural changes in the questionnaire associated with cultural influences. In the second stage, Confirmatory Factor Analysis (CFA) was performed to verify the stability of the resulting factor structure. After the structure had been confirmed, the psychometric properties of the instrument were evaluated, including reliability indicators and several aspects of validity.
Reverse-coded items presented particular challenges and may require further refinement; nevertheless, the overall results indicate acceptable internal consistency and support the use of the instrument in the Kazakhstani context. It should also be noted that the sample was predominantly composed of female participants, highlighting the need for additional testing with a more balanced gender distribution, including a larger number of male participants, to ensure broader applicability and representativeness.
The test-retest reliability analysis of the PCQ, conducted 45 days after the first administration, showed that the correlation coefficients across the scales were within acceptable ranges. Convergent validity testing also produced satisfactory results. The results of the CFA, conducted to evaluate the factor structure of the PCQ-24 in comparison with the original English version, demonstrated good model fit and supported the structural validity of the adapted instrument. The three-factor model of the PCQ-24, consisting of the self-efficacy, resilience, and hope scales, was found to be appropriate for the Kazakh-speaking sample. According to the results of Cronbach’s alpha and McDonald’s omega reliability coefficients, all three scales demonstrated high internal consistency. CFA using the diagonally weighted least squares (DWLS) estimator indicated strong model fit indices, further supporting the structural validity of the adapted instrument.
Based on the results of the reliability and validity analyses, it can be concluded that the adapted version of the psychodiagnostic instrument demonstrates adequate reliability and accurately measures the intended psychological constructs. Overall, the findings of the present study indicate that the Kazakh-language version of the Psychological Capital Questionnaire (PCQ-24) has successfully undergone the main procedures of cultural adaptation and psychometric validation. The revised structure of the questionnaire, identified during the adaptation process for the Kazakh sample, represents a reliable and valid instrument for measuring psychological capital and may be used to assess an individual’s level of psychological capital.
AUTHORS’ CONTRIBUTIONS
The authors confirm their contributions to the paper as follows: Z.M. and A.M.: Study conception and design; N.A. and Zh.M.: Data collection; D.Sh. and Z.M.: Analysis and interpretation of results; B.A. and A.M.: Draft manuscript. All authors reviewed the results and approved the final version of the manuscript.
LIST OF ABBREVIATIONS
| PCQ | = Psychological Capital Questionnaire |
| PsyCAP | = Psychological Capital |
| CFA | = Confirmatory Factor Analysis |
| EFA | = Exploratory Factor Analysis |
| CFI | = Comparative Fit Index |
| TLI | = Tucker-Lewis Index |
| RMSEA | = Root Mean Square Error of Approximation |
| SRMR | = Standardized Root Mean Square Residual |
| SD | = Standard Deviation |
ETHICS APPROVAL AND CONSENT TO PARTICIPATE
The study was approved by the Ethics Committee of Al-Farabi Kazakh National University, Kazakhstan in 2025 (Protocol No. IRB-A1667, Registration No. 119).
HUMAN AND ANIMAL RIGHTS
All human research procedures followed were in accordance with the ethical standards of the committee responsible for human experimentation (institutional and national), and with the Helsinki Declaration of 1975, as revised in 2013.
AVAILABILITY OF DATA AND MATERIALS
The data are available from the second and corresponding author [N.A] on reasonable request.
FUNDING
This research is funded by the Science Committee of the Ministry of Science and Higher Education of the Republic of Kazakhstan (Grant No. AP23488243 “Development of psychodiagnostics in education in Kazakhstan and the world: cross-cultural analysis and development of a validation algorithm”).
ACKNOWLEDGEMENTS
The authors sincerely thank all individuals who participated and provided their insights.