All published articles of this journal are available on ScienceDirect.

Efficiency of Computer Vision in Modulating Happiness: An Interventional Study

Abstract
Introduction/Objective
According to the Facial Feedback Hypothesis, a forceful smile will generate the feeling of happiness in a subject. This could have resulted in a practical self-care activity. However, there is a conspicuous absence of standardized procedures for the forceful smile, and this study was conducted to prove that the precise scoring system from Computer Vision (CV) can induce high levels of happiness.
Methods
Participants were alternately assigned to the CV-assisted or non-CV-assisted (traditional) group. Both groups had to recognise emotions displayed on a computer screen as quickly as possible, in two phases: a control phase and an intervention phase. During the intervention phase, the CV-assisted group had to smile constantly during the task, whereas the traditional group had to bite on a pen sideways. According to the congruency effect, a person experiencing a particular emotion will be more efficient at recognising faces which display the same emotion. Performance was assessed in terms of change in participants’ correct responses while identifying happiness and reaction time for the same, compared to the baseline obtained from the control phase.
Results
The traditional group showed greater improvement in correct responses when identifying happiness. Even when the proportion of correct responses was directly compared between the CV-assisted and traditional groups, the latter had a significantly higher score (p = 0.014).
Discussion
The simpler traditional method seems to have generated higher levels of happiness in this study. Repeated prompts to smile, given to participants in the CV-assisted group, might have hampered their performance; thus, future studies can try to circumvent this.
Conclusion
If precise guidelines are established for the execution of the traditional method, its advantages in generating happiness could be reaped uniformly by all.
1. INTRODUCTION
Happiness is a matter of serious concern. The irony of this statement becomes evident when we consider the daily efforts we put into making ourselves and others happy. Mental health professionals such as psychologists or psychiatrists would assure us that happiness can determine the very chances of survival in some, especially those with suicidal ideation [1, 2]. United Nations General Assembly updates the World Happiness Report every year, and the latest report says that suicide accounts for more than 1 in every 100 deaths [3]. According to the World Health Organization (WHO), among the 970 million people living with mental disorders, 28.9% still suffer from depression [4].
Facial Feedback Hypothesis (FFH): While international agencies aim to implement community-level measures to promote mental health, individuals can also engage in physical activities, such as cardiorespiratory fitness, to improve mental health. This study, however, focuses on a physical activity that involves voluntary contraction of various facial muscles, thereby forcefully causing a smile on the subject’s face. It is well known that facial expressions convey the emotions we feel. There are numerous studies, though, that have shown that facial expressions are not just a result of emotions, but can modulate emotions through feedback mechanisms [5]. The facial feedback hypothesis (FFH) states that, under suitable conditions, altering one’s facial expressions can change the emotions one feels. Then, some studies couldn’t demonstrate the above-mentioned phenomenon. Thus, a debate has been ongoing for almost half a century regarding the existence of such a phenomenon and, if it does exist, precisely under what circumstances.
One important reason for these inconsistencies could be the lack of specificity in the required facial muscle manipulation. In most studies involving FFH, the facial manipulations are performed according to the investigator's instructions. The decision regarding which muscle to contract depends on the belief that a certain muscle acts the most while expressing a certain emotion. Even though there are numerous muscles in our face that can impart an expression, a set of two or three muscles is usually focused upon. Sometimes it is even left to the experimenter to improvise during the experiment, deciding which muscle to contract and how much to contract it. Traditionally, participants are instructed to hold a pen sideways between their teeth, without it touching their lips (Fig. 1) [6].

Biting on a pen sideways without the lips touching it.
This results in a smile and is purported to generate happiness. Without a standardised set of instructions, participants might generate unsatisfactory expressions of emotions. Additionally, unintended involvement of other muscles can result in a mixed emotional expression [7]. There is a need for an easily employable, standardised method for facial muscle contraction. This study thus aimed to harness the potential of computer vision, in which the participants’ facial expressions were analysed using a camera. According to this study’s hypothesis, the change in happiness induced by computer-vision-validated facial expressions will be greater than that induced by the traditional method.
Computer Vision (CV) in emotion recognition: Machine Learning, a type of artificial intelligence (AI), is at the core of modern emotion recognition services. In Machine Learning, a large amount of data, in this case, images of people displaying an emotion, are fed into the system, from which the system learns. This type of AI keeps evolving as more data are supplied to it, and it has been at the core of Computer Vision, enabling computers to understand digital images and videos. Software-related companies, including Google and Microsoft, have utilized this technology to recognise emotions expressed by humans [8]. CV relies on tracking specific facial points to determine the type of emotion is being expressed.
Detection of changes in emotion among participants: Most commonly, emotions elicited by facial muscle manipulation have been detected by asking participants to report them on a scale [9]. There are other variables, such as reaction time to a stimulus, that have been used as replacements for emotional status assessment [10]. Often, reaction time is chosen because it is not completely under participants' control, yet it can still quantify changes in emotional state and is easily measurable. Here, participants were asked to categorize the emotion being expressed in a displayed image, and the resulting reaction time was recorded. This decision is based on the congruency effect, which states that a person experiencing a particular emotion will be more efficient at recognising faces which display the same emotion [11].
The underlying mechanism can be explained by the theory of spreading activation [12]. According to this theory, when an individual experiences an emotion, a representation of that emotion in memory is activated, and the activation spreads to related information. This leads to more efficient processing of emotion-congruent material, due to better perception and retrieval. It was also demonstrated that, compared with controls, participants in a positive emotional state tended to rate low prototypic exemplars of the category as members of the category. Additionally, experimenters found a positive correlation between participants’ emotional intensity and the efficiency with which they processed congruent emotion-laden material [13]. Given the possibility that pre-existing emotions could influence reaction times, rather than comparing only the mean reaction times across the two types of facial muscle manipulations, it was decided to focus on changes in reaction times before and after each manipulation. This comparison will depict the capacity of each method to induce happiness, even in those with a pre-existing emotion.
1.1. Study Tool
In this study, emotion recognition was performed on models’ faces displayed on a computer screen. The pictures from the Montreal Set of Facial Displays of Emotion (MSFDE) were used in this study. It provides standardized images of salient emotions across five morphs [14]. The five morphs are arranged in an order of increasing intensity of that particular emotion. Images of all five intensities of expression from the 2 salient emotions under focus in this study (happiness and sadness), belonging to different races (black and white), expressed by individuals from the biological sexes, male and female, were selected. With respect to gender, it has been argued that, from an evolutionary perspective, males gain an advantage by expressing anger because it signals dominance and deters aggression. On the other hand, females who express happiness signal their willingness to befriend. If these emotional cues are understood well by observers, they can prevent physical harm from males and gain social support from females. Thus, happiness in females and anger in males are processed faster [15]. Racial cues have also been shown to influence the categorization of happiness [16]. Therefore, faces belonging to different biological sexes and races were equally represented in the visual stimuli set. The neutral-expression images were chosen from the validated NimStim Face Stimulus Set [17] because MSFDE does not provide them. This was done to reduce the likelihood of guessing the correct emotion without adequately analysing the images. To maintain consistency, faces were displayed in black-and-white mode against a grey background.
1.2. Role of Mimicry in Emotion Recognition
The capacity of humans to understand others' emotional states by observing their facial expressions appears crucial from an evolutionary perspective [10]. This capacity enabled individuals to avoid the consequences of interacting with someone in a bad mood and to facilitate interactions with those in a favourable state of mind. This detection of emotional status based on facial expressions is augmented by mimicry [18]. Studies have demonstrated that upon viewing a facial expression, the observer automatically mimics it, a process that occurs spontaneously and mostly without the observer’s awareness [19]. Even in instances where the mimicry is not obvious to the human eye, the electromyographic recordings have shown that the facial muscle contraction is associated with a better understanding of others’ displayed emotions. Even a minor stretch of the facial skin stimulates the low-threshold proprioceptive receptors embedded in it. This sends feedback signals to the spinal cord, which then passes them to the higher centres of the brain. This facilitates the simulation of the observed emotion [7]. These emotions nonetheless are considered to be foreign and need not be of the same intensity. The observer can subsequently empathize or remain indifferent, depending on the situation [20].
Additionally, studies have shown that when facial mimicry was prevented, emotion recognition, especially of subtle emotions, was less efficient than when mimicry was allowed [18]. It should be noted here that, even though mimicry is considered to be important in the detection of an emotion, it is not vital for the process. Patients who had paralysis of facial muscles were found to have difficulty in emotion recognition, but were not completely devoid of the capability. This provides strong evidence that mimicry augments emotion detection [7]. It is important to note here that while spontaneous mimicry of emotions resembles bottom-up processing, the facial feedback mechanism resembles top-down processing (Fig. 2).
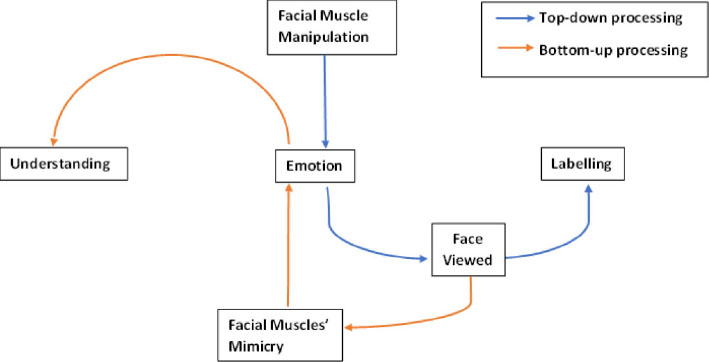
Two overlapping processes in emotion recognition.
Spontaneous mimicry, as useful as it is, can also confound. It can result in efficient processing of the incongruent emotional material. To illustrate, if a subject is made to display a happy facial expression, it is expected that images of incongruent emotions, such as sadness and anger, will be processed slowly. But facial mimicry can lead to comparatively better processing of these incongruent emotional materials. In this study, a control phase was planned for all participants, during which subjects were instructed not to express any emotion. As this prevents mimicry, bottom-up processing will not be activated. Specifically, as the subjects did not smile, top-down processing was curtailed in this phase as well.
This study was conducted to compare changes in the proportion of correct responses when recognising happiness, and in reaction times for the same emotion recognition between CV-aided and non-CV-aided (traditional) facial muscle manipulation. This comparison is intended to demonstrate that a precise scoring system based on Computer Vision (CV) can induce higher levels of happiness.
2. MATERIALS AND METHODS
Sample Size: Calculated using a power analysis based on an effect size of 0.66, derived from a similar study [21]. With a power of 90% and a 20% non-response rate, each group's sample size was 72. Thus, a total of 144 participants were considered appropriate for this study.
2.1. Participants
2.2. Study Design
This is an interventional study.
Four participants from the traditional group and two from the CV-assisted group were excluded from the study due to issues with near vision and inability to comply with the full set of instructions. Thus, there were 68 participants in the traditional and 70 in the CV-assisted group. Overall, 56 of them were males with an age range of 19 to 35 years, and the remaining 82 were females whose age range was from 18 to 32 years. Data were collected for 2 months, between May and June 2022, in Mangalore.
2.3. Cover Story
During the experiment, if participants were told the study's actual purpose, some would have altered their performance depending on which group they belonged to, resulting in expectation bias [22]. Thus, a cover story was created, based on which the study's purpose was initially explained to the participants, and the original intent was later explained to them. Participants were told that the study's objective was to assess their multitasking capacity. Two activities this study would be monitoring are: the ability to contract certain facial muscles and to simultaneously recognise emotions displayed on a computer screen as quickly as possible. The top two performers would even get a cash prize. To help participants feel less intimidated by the need to multitask and avoid hampering their performance, efforts were made to put them at ease. Examples of day-to-day activities involving multitasking were provided. It was explained that the reason for choosing facial muscles in particular was the ease with which uniformity in the tasks performed by all participants could be ensured. Additionally, at the end of the session, to find out whether the cover story was effective, they were asked what they thought about the real purpose of the procedures.
2.4. Procedure
Participants appearing for the study were assigned to either one of the two groups: CV-assisted or non-CV-assisted, alternately. They were informed that they would have to produce certain shapes with their lips, such as a smile or a dash (−), and that they would have to compulsorily produce the whistling sound (O). For both groups’ control phase, participants were instructed to produce the shape of ‘O’ with their lips, and this required them to purse their lips as in whistling (Fig. 3). This would prevent spontaneous mimicry [18]. Additionally, the 'O' shape of the lips is not consistently associated with the expression of any emotion. Facial Action Coding System is a widely followed framework to classify emotions based on facial movements, and according to it, the ‘O’ shape of the lips does not signify any major emotion [23]. Together, these would ensure that neither top-down nor bottom-up processing is facilitated during the control phase.
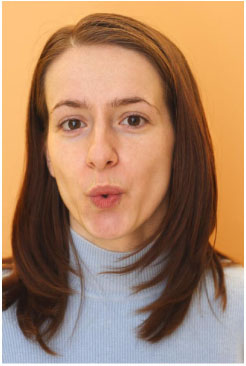
Whistling shape of lips in the control phase.
For the intervention phase of the CV-assisted group, they had to smile. For the intervention phase of the traditional group, they had to bite on a disposable tongue depressor or a pen sideways, without touching their lips to it, and this would enable them to achieve a dash shape with their lips (Fig. 1). If the shape produced was satisfactory, participants had to continue using it while labeling emotions displayed on a computer screen. Participants were assured of reasonable privacy while producing the shapes mentioned above.
For the emotion recognition task, images belonging to different races (Black and White), of two biological sexes (Male and Female), expressing different intensities (5 grades) of the main emotions under focus (Happiness and Sadness), and images of neutral expression of two sexes and races were shown once. Thus, a total of 40 + 4 = 44 images were required to be labelled for each phase (control and intervention). Grades of expressions range from one to five, with five being the one with the maximum intensity. Sufficient time was provided to the participants to practice labelling the facial expressions and to clear their queries.
Participants were seated approximately 0.80 metres away from a 19.5-inch LCD computer monitor (refresh rate: 60 Hz, display resolution: 1440 x 900). All the images displayed on the screen were resized such that a visual angle of about 13 degrees vertically and 10 degrees horizontally was subtended. The task of displaying these images and measuring the time participants took to detect the emotions in them was carried out using Windows desktop software named Open Sesame (Version 3.3) [24].
Before each image, a fixation dot was displayed, and participants could start only when they felt comfortable. This would display an image for emotion labelling on the screen, and participants had to choose a response as early as possible. If no response was given for 2 seconds, then it was considered an error. There were three keys (A, B, and L) required for identifying three different expressions portrayed. The pairing of keys and emotions was not kept constant, though. A total of six permutations were created, and these were counterbalanced across participants. They were instructed to signal the experimenter at the earliest about any distraction or unwillingness to continue, so that the appropriate measure could be taken.
During the intervention phase, participants' facial expressions were continuously monitored using Microsoft Cognitive Services (Version 3.0.0 - 16.11.106.23128) running in Visual Studio on another Windows desktop computer. The application program interface (API) was called once every 3 seconds, so participants' facial expressions were corrected almost as soon as they deviated from the given guidelines. Participants in the CV-assisted group had to smile constantly while performing the tasks during the intervention phase. The threshold for a definitive expression of happiness was set at 80%, and if the Cognitive Service scores fell below this level, a reminder to smile was issued. Even though only one of the two groups was assisted by computer vision, facial expression monitoring was performed by it in both groups (Fig. 4).
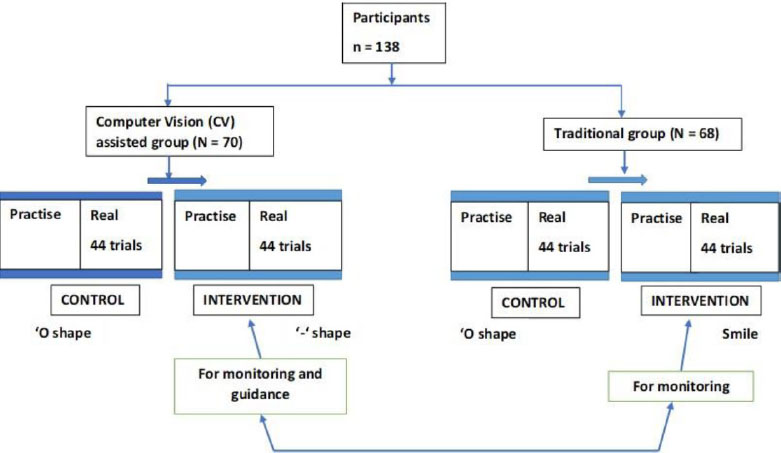
The division of participants.
2.5. Statistical Analysis
The assessment of the two groups' performance was mainly based on changes in two parameters, with control-phase readings as the baseline. First, the proportion of correct labelling of happy faces was compared using the McNemar test. The normality of reaction times was tested using Shapiro-Wilk’s test p > 0.05 and the comparison of the mean reaction time in milliseconds (ms) for those correct responses was performed using the paired t-test. SPSS version 23 was used to perform the statistical analysis. All the above-mentioned tests were two-tailed, with α = 0.05. Multiple comparisons were performed wherever possible; adjusted p-values were calculated using the Bonferroni method. It was decided in advance that if participants suspected an association between facial muscle manipulation and emotions, their data would not be used for further analysis. Participants’ performance was mainly assessed in terms of change in correct responses and reaction time, compared to the baseline obtained from the control phase. The results regarding these in both groups are of primary importance to this study.
3. RESULTS
A total of 12144 reaction time readings were available for statistical analysis (138 participants x 88 timed performances). The participants’ ages ranged from 18 to 35 years (M = 21.65, S.D. = 1.63). The proportion of female participants was 59%, and the proportion of male participants was 41%. Regarding educational background, medical students accounted for 57% of the participants, and engineering students accounted for 43%. Only four participants were predominantly left-handed. None of the participants reported inconvenience while following instructions or requested to stop the trials midway. The CV-assisted and non-CV-assisted (traditional) groups were age-matched (p = 0.933) and sex-matched (p = 0.58).
Overall, during the intervention phase, participants in both the CV-assisted and traditional groups demonstrated an increase in the proportion of correct responses when labelling happy faces. McNemar tests performed on the paired data showed that the difference was statistically significant (Tables 1 and 2). Both CV-assisted and traditional groups continued to show statistically significant improvements (p < 0.05) when male participants were considered. However, among females, only the traditional group showed a significant improvement (p < 0.001). Similarly, CV-assisted and traditional groups showed statistically significant improvements in correct responses when only medical students were considered (p < 0.05), but with engineering students, only the traditional group showed improvement (p = 0.006). Within these groups, when further analyses were performed, the traditional group (Supplementary Table S1) consistently showed more significant performance improvements than the CV-assisted group (Supplementary Table S2). These analyses were performed across subgroups defined by the different model parameters shown in the photos, such as sex, race, and levels of happiness expression. Of these, the sex and race parameters are displayed together in the results as Female-Black (FB), Female-White (FW), Male-Black (MB), and Male-White (MW).
| - | Grades of Expression of Models | Pre-intervention Phase Response | Post-intervention Phase Response | p-value | |
|---|---|---|---|---|---|
| Incorrect Response | Correctly Recognized as Happiness | ||||
| MW | 1 | Incorrect | 42 | 14 | 0.115 |
| Correct | 6 | 8 | |||
| 2 | Incorrect | 5 | 13 | 0.383 | |
| Correct | 8 | 44 | |||
| 3 | Incorrect | 0 | 2 | 1 | |
| Correct | 2 | 66 | |||
| 4 | Incorrect | 0 | 1 | NA | |
| Correct | 0 | 69 | |||
| 5 | Incorrect | 0 | 1 | NA | |
| Correct | 0 | 69 | |||
| Total | Incorrect | 47 | 31 | 0.04* | |
| Correct | 16 | 256 | |||
| MB | 1 | Incorrect | 44 | 12 | 0.359 |
| Correct | 7 | 7 | |||
| 2 | Incorrect | 7 | 18 | 0.076 | |
| Correct | 8 | 37 | |||
| 3 | Incorrect | 1 | 2 | 0.688 | |
| Correct | 4 | 63 | |||
| 4 | Incorrect | 0 | 4 | 0.688 | |
| Correct | 2 | 64 | |||
| 5 | Incorrect | 0 | 4 | 0.375 | |
| Correct | 1 | 65 | |||
| Total | Incorrect | 52 | 40 | 0.03* | |
| Correct | 22 | 236 | |||
| FW | 1 | Incorrect | 53 | 11 | 0.210 |
| Correct | 5 | 1 | |||
| 2 | Incorrect | 22 | 10 | 0.832 | |
| Correct | 12 | 26 | |||
| 3 | Incorrect | 0 | 3 | 1 | |
| Correct | 4 | 63 | |||
| 4 | Incorrect | 0 | 1 | 0.375 | |
| Correct | 4 | 65 | |||
| 5 | Incorrect | 0 | 2 | 1 | |
| Correct | 3 | 65 | |||
| Total | Incorrect | 75 | 27 | 1 | |
| Correct | 28 | 220 | |||
| FB | 1 | Incorrect | 26 | 19 | 0.087 |
| Correct | 9 | 16 | |||
| 2 | Incorrect | 4 | 9 | 1 | |
| Correct | 8 | 49 | |||
| 3 | Incorrect | 0 | 2 | 1 | |
| Correct | 3 | 65 | |||
| 4 | Incorrect | 0 | 2 | NA | |
| Correct | 0 | 68 | |||
| 5 | Incorrect | 0 | 0 | NA | |
| Correct | 1 | 69 | |||
| Total | Incorrect | 30 | 32 | 0.169 | |
| Correct | 21 | 267 | |||
| Grade total | |||||
| - | 1 | Incorrect | 165 | 56 | 0.002* |
| Correct | 27 | 32 | |||
| - | 2 | Incorrect | 38 | 50 | 0.161 |
| Correct | 36 | 156 | |||
| - | 3 | Incorrect | 1 | 9 | 0.523 |
| Correct | 13 | 257 | |||
| - | 4 | Incorrect | 0 | 8 | 0.791 |
| Correct | 6 | 266 | |||
| - | 5 | Incorrect | 0 | 7 | 0.774 |
| Correct | 5 | 268 | |||
| Grand total | |||||
| - | Incorrect | 204 | 130 | 0.004* | |
| Correct | 87 | 979 | |||
Note: * - Significance at α = 0.05.
NA – results not available because of values less than the number required to compute.
Abbreviations: MW, male white; MB, male black; FW, female white; FB, female black.
| - | Grades of Expression of Models | Pre-intervention Phase Response | Post-intervention Phase Response | p-value | |
|---|---|---|---|---|---|
| Incorrect Response | Correctly Recognized as Happiness | ||||
| MW | 1 | Incorrect | 33 | 17 | 0.169 |
| Correct | 9 | 9 | |||
| 2 | Incorrect | 3 | 12 | 0.238 | |
| Correct | 6 | 47 | |||
| 3 | Incorrect | 1 | 3 | 1 | |
| Correct | 2 | 62 | |||
| 4 | Incorrect | 0 | 1 | NA | |
| Correct | 0 | 67 | |||
| 5 | Incorrect | 0 | 0 | NA | |
| Correct | 0 | 68 | |||
| Total | Incorrect | 37 | 33 | 0.033* | |
| Correct | 17 | 253 | |||
| MB | 1 | Incorrect | 39 | 9 | 0.664 |
| Correct | 12 | 8 | |||
| 2 | Incorrect | 6 | 18 | 0.004* | |
| Correct | 4 | 40 | |||
| 3 | Incorrect | 0 | 3 | 1 | |
| Correct | 2 | 63 | |||
| 4 | Incorrect | 0 | 2 | 1 | |
| Correct | 1 | 65 | |||
| 5 | Incorrect | 0 | 1 | NA | |
| Correct | 0 | 67 | |||
| Total | Incorrect | 45 | 33 | 0.07 | |
| Correct | 19 | 243 | |||
| FW | 1 | Incorrect | 46 | 14 | 0.013* |
| Correct | 3 | 5 | |||
| 2 | Incorrect | 10 | 13 | 0.049* | |
| Correct | 4 | 41 | |||
| 3 | Incorrect | 0 | 9 | 0.146 | |
| Correct | 3 | 56 | |||
| 4 | Incorrect | 0 | 0 | NA | |
| Correct | 2 | 66 | |||
| 5 | Incorrect | 0 | 1 | 1 | |
| Correct | 1 | 66 | |||
| Total | Incorrect | 56 | 37 | 0.001* | |
| Correct | 13 | 234 | |||
| FB | 1 | Incorrect | 26 | 18 | 0.043* |
| Correct | 7 | 17 | |||
| 2 | Incorrect | 4 | 9 | 0.267 | |
| Correct | 4 | 51 | |||
| 3 | Incorrect | 0 | 4 | 0.688 | |
| Correct | 2 | 62 | |||
| 4 | Incorrect | 0 | 2 | 1 | |
| Correct | 3 | 63 | |||
| 5 | Incorrect | 0 | 4 | NA | |
| Correct | 0 | 64 | |||
| Total | Incorrect | 30 | 37 | 0.005* | |
| Correct | 16 | 257 | |||
| Grade total | |||||
| - | 1 | Incorrect | 144 | 58 | 0.006* |
| Correct | 31 | 39 | |||
| - | 2 | Incorrect | 23 | 52 | <0.001* |
| Correct | 18 | 179 | |||
| - | 3 | Incorrect | 1 | 19 | 0.087 |
| Correct | 9 | 243 | |||
| - | 4 | Incorrect | 0 | 5 | 1 |
| Correct | 6 | 261 | |||
| - | 5 | Incorrect | 0 | 6 | 0.125 |
| Correct | 1 | 265 | |||
| Grand total | |||||
| - | Incorrect | 168 | 140 | <0.001* | |
| Correct | 65 | 987 | |||
Note: * - Significance at α = 0.05.
NA – results not available because of less of less than the number required to compute.
Abbreviations: MW, male white; MB, male black; FW, female white; FB, female black.
Before the intervention, the mean reaction time to identify a photo in the CV-assisted group was 859.39 × 10^-3 seconds (ms), with a standard deviation of 193.75 ms, and in the traditional group it was 857.48 m,s with a standard deviation of 159.62 ms. Table 3 presents the change scores for correct responses post-intervention for both groups. The change in reaction time compared to the control group was analyzed using paired t-tests. A significant change in performance post-intervention was seen in both the CV-assisted [t(69) = 5.36, p < 0.001] and the traditional group [t(67) = 4.77, p < 0.001] (Tables 4 and 5). These patterns were consistent even when males and females, and medical and engineering students, were analyzed separately for the CV-assisted (Supplementary Table S3) and traditional groups (Supplementary Table S4).
| Change Scores in Milliseconds (ms) | |||
|---|---|---|---|
| Group | Traditional Group | CV-assisted Group |
Difference between CV-assisted Group and Traditional Group |
| Overall n (Traditional group) = 68 n (CV-assisted group) = 70 |
66.72 | 80.56 | 13.84 |
| Females n (Traditional group) = 42 n (CV-assisted group) = 40 |
66.72 | 96.18 | 29.46 |
| Males n (Traditional group) = 26 n (CV-assisted group) = 30 |
66.71 | 59.75 | -6.96 |
| Medical students n (Traditional group) = 35 n (CV-assisted group) = 42 |
63.9 | 87.52 | 23.62 |
| Engineering students n (Traditional group) = 31 n (CV-assisted group) = 28 |
69.23 | 70.15 | 0.92 |
| - | Grades of Expression of Happiness by Models | Pre or Post Intervention Phase | n | Mean (ms) | Standard Deviation (ms) | Confidence Interval | p-value |
|---|---|---|---|---|---|---|---|
| MW | 1 | Pre | 8 | 1248 | 423.42 | 954.58-1541.42 | 0.032* |
| Post | 869.63 | 291 | 667.98-1071.28 | ||||
| 2 | Pre | 44 | 939.25 | 295.74 | 851.86-1026.64 | 0.005* | |
| Post | 782.25 | 245.09 | 709.83-854.67 | ||||
| 3 | Pre | 66 | 830.64 | 273.72 | 764.6-896.68 | 0.026 | |
| Post | 753.5 | 235.6 | 696.66-810.34 | ||||
| 4 | Pre | 69 | 814.07 | 311.1 | 740.66-887.48 | 0.013* | |
| Post | 708.07 | 246.86 | 649.82-766.32 | ||||
| 5 | Pre | 69 | 816 | 278.85 | 750.2-881.8 | 0.005* | |
| Post | 714.67 | 242.95 | 657.34-772 | ||||
| Total | Pre | 70 | 857.97 | 221.83 | 806-909.94 | <0.001* | |
| Post | 741.95 | 184 | 698.85-785.05 | ||||
| MB | 1 | Pre | 7 | 1001 | 256.5 | 810.98-1191.02 | 0.652 |
| Post | 1065.86 | 366.16 | 794.6-1337.12 | ||||
| 2 | Pre | 37 | 977.84 | 364.47 | 860.4-1095.28 | 0.03* | |
| Post | 855.22 | 313.4 | 754.24-956.2 | ||||
| 3 | Pre | 63 | 816.17 | 237.99 | 757.4-874.94 | 0.708 | |
| Post | 798.35 | 337.55 | 715-881.7 | ||||
| 4 | Pre | 64 | 798.45 | 256.39 | 735.63-861.27 | 0.081 | |
| Post | 747.19 | 235.74 | 689.43-804.95 | ||||
| 5 | Pre | 65 | 806.68 | 269.94 | 741.06-872.3 | 0.057 | |
| Post | 730.74 | 262.21 | 666.99-794.49 | ||||
| Total | Pre | 69 | 850.63 | 216.21 | 799.61-901.65 | 0.07 | |
| Post | 801.72 | 228.39 | 747.83-855.61 | ||||
| FW | 1 | Pre | 1 | 978 | NA | - | NA |
| Post | 1108 | NA | - | ||||
| 2 | Pre | 26 | 1020.27 | 393.59 | 868.98-1171.56 | 0.039* | |
| Post | 859.73 | 270.1 | 755.91-963.55 | ||||
| 3 | Pre | 63 | 899.76 | 358.8 | 811.16-988.36 | 0.002* | |
| Post | 753.14 | 187.06 | 706.95-799.33 | ||||
| 4 | Pre | 65 | 816.74 | 297.39 | 744.44-889.04 | 0.389 | |
| Post | 779.32 | 289.83 | 708.86-849.78 | ||||
| 5 | Pre | 65 | 836.77 | 283.42 | 767.87-905.67 | 0.047* | |
| Post | 762.17 | 229.71 | 706.33-818.01 | ||||
| Total | Pre | 70 | 889.7 | 275.9 | 825.07-954.33 | <0.001* | |
| Post | 782.6 | 183.87 | 739.53-825.67 | ||||
| FB | 1 | Pre | 16 | 1134.56 | 349.61 | 963.25-1305.87 | 0.296 |
| Post | 1009.75 | 268.58 | 878.15-1141.35 | ||||
| 2 | Pre | 49 | 934.8 | 348.66 | 837.18-1032.42 | 0.095 | |
| Post | 835.88 | 278.98 | 757.77-913.99 | ||||
| 3 | Pre | 65 | 804.54 | 281.71 | 736.05-873.03 | 0.382 | |
| Post | 771.68 | 292.27 | 700.63-842.73 | ||||
| 4 | Pre | 68 | 783.96 | 219.92 | 731.69-836.23 | 0.569 | |
| Post | 767.1 | 248.87 | 707.95-826.25 | ||||
| 5 | Pre | 69 | 762.91 | 257.78 | 702.09-823.73 | 0.042* | |
| Post | 710.52 | 198.3 | 663.73-757.31 | ||||
| Total | Pre | 70 | 833.49 | 205.05 | 785.45-881.53 | 0.019* | |
| Post | 785.03 | 190.2 | 740.47-829.59 | ||||
| - | Grade total | ||||||
| - | 1 | Pre | 22 | 1122.42 | 319.88 | 988.75-1256.09 | 0.068 |
| Post | 981.45 | 229.87 | 885.39-1077.51 | ||||
| 2 | Pre | 62 | 1011.61 | 331 | 929.22-1094 | <0.001* | |
| Post | 829.2 | 219.4 | 774.59-883.81 | ||||
| 3 | Pre | 70 | 854.92 | 246.75 | 797.12-912.72 | 0.004* | |
| Post | 776.11 | 232.02 | 721.76-830.46 | ||||
| 4 | Pre | 70 | 806.26 | 204.67 | 758.31-854.21 | 0.007* | |
| Post | 755.74 | 196.2 | 709.78-801.7 | ||||
| 5 | Pre | 70 | 810.76 | 211.4 | 761.24-860.28 | <0.001* | |
| Post | 736.39 | 184.89 | 693.08-779.7 | ||||
| - | Grand total | ||||||
| - | - | Pre | 70 | 859.34 | 193.75 | 813.95-904.73 | <0.001* |
| Post | 778.83 | 172.85 | 738.34-819.32 | ||||
Note: * - Significance at α = 0.05.
NA – results not available because of less of less than the number required to compute.
Abbreviations: MW, male white; MB, male black; FW, female white; FB, female black.
| - | Grades of Expression of Happiness by Models | Pre or Post Intervention Phase | n | Mean (ms) | Standard Deviation (ms) | Confidence Internal | p-value |
|---|---|---|---|---|---|---|---|
| MW | 1 | Pre | 9 | 1141.89 | 520.99 | 801.51-1482.27 | 0.711 |
| Post | 1081.11 | 417.98 | 808.03-1354.19 | ||||
| 2 | Pre | 47 | 864.47 | 252.97 | 792.15-936.79 | 0.541 | |
| Post | 833.43 | 275.75 | 754.59-912.27 | ||||
| 3 | Pre | 62 | 820.52 | 229.53 | 763.39-877.65 | 0.005* | |
| Post | 737.79 | 189.55 | 690.61-784.97 | ||||
| 4 | Pre | 67 | 823.79 | 302.77 | 751.29-896.29 | 0.013* | |
| Post | 738.21 | 224.66 | 684.41-792.01 | ||||
| 5 | Pre | 68 | 759.09 | 240.76 | 701.86-816.32 | 0.725 | |
| Post | 769.46 | 258.74 | 707.96-830.96 | ||||
| Total | Pre | 68 | 835.73 | 202.41 | 787.62-883.84 | 0.014* | |
| Post | 787.8 | 177.21 | 745.68-829.92 | ||||
| MB | 1 | Pre | 8 | 1061.88 | 425.13 | 767.28-1356.48 | 0.52 |
| Post | 922.88 | 214.49 | 774.25-1071.51 | ||||
| 2 | Pre | 40 | 972.5 | 344.05 | 865.88-1079.12 | 0.385 | |
| Post | 911.73 | 338.72 | 806.76-1016.7 | ||||
| 3 | Pre | 63 | 834.79 | 274.93 | 766.9-902.68 | 0.9 | |
| Post | 828.59 | 326.16 | 748.05-909.13 | ||||
| 4 | Pre | 65 | 788.55 | 178.56 | 745.14-831.96 | 0.556 | |
| Post | 770.86 | 212.07 | 719.3-822.42 | ||||
| 5 | Pre | 67 | 801.31 | 224.01 | 747.67-854.95 | 0.072 | |
| Post | 737.73 | 263.24 | 674.7-800.76 | ||||
| Total | Pre | 68 | 847.29 | 173.9 | 805.96-888.62 | 0.071 | |
| Post | 812.61 | 194.15 | 766.46-858.76 | ||||
| FW | 1 | Pre | 5 | 980.6 | 256.8 | 755.5-1205.7 | 0.314 |
| Post | 844 | 100.57 | 755.85-932.15 | ||||
| 2 | Pre | 41 | 1026.22 | 306.42 | 932.42-1120.02 | 0.175 | |
| Post | 936.68 | 280.57 | 850.8-1022.56 | ||||
| 3 | Pre | 56 | 880.7 | 286.3 | 805.71-955.69 | 0.012* | |
| Post | 762.77 | 273.38 | 691.17-834.37 | ||||
| 4 | Pre | 66 | 841.35 | 290.03 | 771.38-911.32 | 0.005* | |
| Post | 730.5 | 207.9 | 680.34-780.66 | ||||
| 5 | Pre | 66 | 786.64 | 246.50 | 727.17-846.11 | 0.046* | |
| Post | 716.53 | 208.03 | 666.34-766.72 | ||||
| Total | Pre | 68 | 871.47 | 210.89 | 821.34-921.6 | <0.001* | |
| Post | 777.02 | 157.76 | 739.52-814.52 | ||||
| FB | 1 | Pre | 17 | 999.24 | 356.93 | 829.57-1168.91 | 0.689 |
| Post | 1041.24 | 299.52 | 898.86-1183.62 | ||||
| 2 | Pre | 51 | 914.27 | 316.7 | 827.35-1001.19 | 0.022* | |
| Post | 789.75 | 289.6 | 710.27-869.23 | ||||
| 3 | Pre | 62 | 870.74 | 277.09 | 801.77-939.71 | 0.018* | |
| Post | 767.87 | 227.3 | 711.29-824.45 | ||||
| 4 | Pre | 63 | 810.87 | 284.77 | 740.55-881.19 | 0.143 | |
| Post | 744.83 | 211.47 | 692.61-797.05 | ||||
| 5 | Pre | 64 | 802.34 | 261.43 | 738.29-866.39 | 0.005* | |
| Post | 716.89 | 151.43 | 679.79-753.99 | ||||
| Total | Pre | 68 | 866 | 212.07 | 815.59-916.41 | 0.001* | |
| Post | 773.93 | 153.45 | 737.46-810.4 | ||||
| - | Grade total | ||||||
| - | 1 | Pre | 26 | 1073.58 | 416.97 | 913.3-1233.86 | 0.471 |
| Post | 1007.54 | 281.23 | 899.44-1115.64 | ||||
| 2 | Pre | 61 | 943.17 | 204.88 | 891.75-994.59 | 0.012* | |
| Post | 867.18 | 222.53 | 811.34-923.02 | ||||
| 3 | Pre | 68 | 871.18 | 202.03 | 823.16-919.2 | 0.006* | |
| Post | 804.62 | 224.8 | 751.19-858.05 | ||||
| 4 | Pre | 68 | 819.61 | 189.3 | 774.62-864.6 | 0.001* | |
| Post | 749.14 | 148.03 | 713.96-784.32 | ||||
| 5 | Pre | 68 | 792.2 | 180.44 | 749.31-835.09 | 0.005* | |
| Post | 740.19 | 169.63 | 699.87-780.51 | ||||
| - | Grand total | ||||||
| - | - | Pre | 68 | 857.48 | 159.62 | 819.54-895.42 | <0.001* |
| Post | 790.77 | 138.07 | 757.95-823.59 | ||||
Note: * - Significance at α = 0.05.
Abbreviations: MW, male white; MB, male black; FW, female white; FB, female black.
Overall, when the proportion of correct responses in the control phase was compared directly between the CV-assisted and traditional groups, no significant difference was found. The lack of significance was also observed for reaction time of correct responses, even when the analysis was done separately for females, males, medical students, and engineering students. Thus, the baseline performances of the two groups were comparable.
Regarding post-intervention performance, the traditional group showed a higher proportion of correct responses than the CV-assisted group. Chi Square/Fisher Exact tests performed on the data showed that the difference was significant (p = 0.014) when the overall set was considered (Table 6). The same was true when females’ responses (p = 0.005) and medical students’ responses (0.008) were considered separately (Supplementary Table S5).
| - | Grades of Expression of Models | CV-assisted or Traditional Group | Correctly Recognized as Happiness | Incorrect Response | p-value |
|---|---|---|---|---|---|
| MW | 1 | CV-assisted | 22 | 48 | 0.401 |
| Traditional | 26 | 42 | |||
| 2 | CV-assisted | 57 | 13 | 0.391 | |
| Traditional | 59 | 9 | |||
| 3 | CV-assisted | 68 | 2 | 0.678 | |
| Traditional | 65 | 3 | |||
| 4 | CV-assisted | 70 | 0 | 1 | |
| Traditional | 68 | 0 | |||
| 5 | CV-assisted | 70 | 0 | 1 | |
| Traditional | 68 | 0 | |||
| Total | CV-assisted | 287 | 63 | 0.458 | |
| Traditional | 286 | 54 | |||
| MB | 1 | CV-assisted | 19 | 51 | 0.774 |
| Traditional | 17 | 51 | |||
| 2 | CV-assisted | 55 | 15 | 0.305 | |
| Traditional | 58 | 10 | |||
| 3 | CV-assisted | 65 | 5 | 0.441 | |
| Traditional | 66 | 2 | |||
| 4 | CV-assisted | 68 | 2 | 1 | |
| Traditional | 67 | 1 | |||
| 5 | CV-assisted | 69 | 1 | 1 | |
| Traditional | 68 | 0 | |||
| Total | CV-assisted | 276 | 74 | 0.446 | |
| Traditional | 276 | 64 | |||
| FW | 1 | CV-assisted | 12 | 58 | 0.128 |
| Traditional | 19 | 49 | |||
| 2 | CV-assisted | 36 | 34 | <0.001* | |
| Traditional | 54 | 14 | |||
| 3 | CV-assisted | 66 | 4 | 1 | |
| Traditional | 65 | 3 | |||
| 4 | CV-assisted | 66 | 4 | 0.680 | |
| Traditional | 66 | 2 | |||
| 5 | CV-assisted | 67 | 3 | 0.619 | |
| Traditional | 67 | 1 | |||
| Total | CV-assisted | 247 | 103 | 0.005* | |
| Traditional | 271 | 69 | |||
| FB | 1 | CV-assisted | 35 | 35 | 0.862 |
| Traditional | 35 | 33 | |||
| 2 | CV-assisted | 58 | 12 | 0.369 | |
| Traditional | 60 | 8 | |||
| 3 | CV-assisted | 67 | 3 | 1 | |
| Traditional | 66 | 2 | |||
| 4 | CV-assisted | 70 | 0 | 0.116 | |
| Traditional | 65 | 3 | |||
| 5 | CV-assisted | 69 | 1 | 1 | |
| Traditional | 68 | 0 | |||
| Total | CV-assisted | 299 | 51 | 0.693 | |
| Traditional | 294 | 46 | |||
| Grade total | |||||
| - | 1 | CV-assisted | 88 | 192 | 0.292 |
| Traditional | 97 | 175 | |||
| - | 2 | CV-assisted | 206 | 74 | 0.001* |
| Traditional | 231 | 41 | |||
| - | 3 | CV-assisted | 266 | 14 | 0.445 |
| Traditional | 262 | 10 | |||
| - | 4 | CV-assisted | 274 | 6 | 0.959 |
| Traditional | 266 | 6 | |||
| - | 5 | CV-assisted | 275 | 5 | 0.216 |
| Traditional | 271 | 1 | |||
| Grand total | |||||
| - | CV-assisted | 1109 | 291 | 0.014* | |
| Traditional | 1127 | 233 | |||
Note: * - Significance at α = 0.05.
Abbreviations: MW, male white; MB, male black; FW, female white; FB, female black.
Further, independent t-tests were applied to reaction times for correct responses. Overall, no significant difference was observed between the CV-assisted and the traditional groups (Table 7). During subgroup analysis, in FW models with grade 5 expression when recognized by medical students, the traditional group performed significantly better, and in FW models with grade 2 expression when recognized by engineering students, the CV-assisted group demonstrated significantly better performance. The rest of them showed non-significant differences (Supplementary Table S6). Of the two instances that showed significance, there was no consistency in the superiority of either the CV-assisted or the traditional groups. If all the significance tests calculated are considered, it was evident that the greatest advantage of interventions (CV or traditional) occurred when participants viewed photos of white females with a smile of grade 2 intensity.
| - | Grades of Expression of Models | CV-assisted or Traditional Group | n | Mean (ms) | Standard Deviation (ms) | Confidence Interval | p-value |
|---|---|---|---|---|---|---|---|
| MW | 1 | CV-assisted | 22 | 1030.73 | 359.07 | 880.68-1180.78 | 0.543 |
| Traditional | 26 | 1097.73 | 392.78 | 946.75-1248.71 | |||
| 2 | CV-assisted | 57 | 834.21 | 310.16 | 753.69-914.73 | 0.594 | |
| Traditional | 59 | 863.85 | 286.37 | 790.78-936.92 | |||
| 3 | CV-assisted | 68 | 754.47 | 235.15 | 698.58-810.36 | 0.879 | |
| Traditional | 65 | 760.46 | 215.97 | 707.96-812.96 | |||
| 4 | CV-assisted | 70 | 725.16 | 283.7 | 658.7-791.62 | 0.757 | |
| Traditional | 68 | 738.65 | 223 | 685.65-791.65 | |||
| 5 | CV-assisted | 70 | 721.77 | 248.4 | 663.58-779.96 | 0.271 | |
| Traditional | 68 | 769.46 | 258.73 | 707.96-830.96 | |||
| Total | CV-assisted | 70 | 774.63 | 194.07 | 729.17-820.09 | 0.249 | |
| Traditional | 68 | 812.04 | 185.51 | 767.95-856.13 | |||
| MB | 1 | CV-assisted | 19 | 1069.16 | 324.6 | 923.2-1215.12 | 0.542 |
| Traditional | 17 | 1010.94 | 227.32 | 902.88-1119 | |||
| 2 | CV-assisted | 55 | 912.85 | 341.05 | 822.72-1002.98 | 0.937 | |
| Traditional | 58 | 907.83 | 329.15 | 823.12-992.54 | |||
| 3 | CV-assisted | 65 | 792.52 | 333.93 | 711.34-873.7 | 0.541 | |
| Traditional | 66 | 828.11 | 329.92 | 748.51-907.71 | |||
| 4 | CV-assisted | 68 | 756.72 | 240.51 | 699.55-813.89 | 0.594 | |
| Traditional | 67 | 778.25 | 226.78 | 723.95-832.55 | |||
| 5 | CV-assisted | 69 | 739.84 | 263.9 | 677.57-802.11 | 0.904 | |
| Traditional | 68 | 745.35 | 268.72 | 681.48-809.22 | |||
| Total | CV-assisted | 70 | 822.93 | 218.14 | 771.83-874.03 | 0.867 | |
| Traditional | 68 | 828.74 | 187.07 | 784.28-873.2 | |||
| FW | 1 | CV-assisted | 12 | 1024.5 | 333.79 | 835.64-1213.36 | 0.912 |
| Traditional | 19 | 1011.89 | 290.61 | 881.22-1142.56 | |||
| 2 | CV-assisted | 36 | 872.28 | 256.38 | 788.53-956.03 | 0.263 | |
| Traditional | 54 | 938.78 | 285.29 | 862.69-1014.87 | |||
| 3 | CV-assisted | 66 | 756.82 | 198.32 | 708.97-804.67 | 0.256 | |
| Traditional | 65 | 811.23 | 331.78 | 730.57-891.89 | |||
| 4 | CV-assisted | 66 | 777.64 | 287.92 | 708.18-847.1 | 0.283 | |
| Traditional | 66 | 730.5 | 207.9 | 680.34-780.66 | |||
| 5 | CV-assisted | 67 | 757.34 | 227.92 | 702.76-811.92 | 0.309 | |
| Traditional | 67 | 718.87 | 207.33 | 669.22-768.52 | |||
| Total | CV-assisted | 70 | 794.11 | 182.34 | 751.39-836.83 | 0.511 | |
| Traditional | 68 | 814.21 | 175.93 | 772.39-856.03 | |||
| FB | 1 | CV-assisted | 35 | 989.94 | 261.2 | 903.4-1076.48 | 0.255 |
| Traditional | 35 | 1071 | 325.59 | 963.13-1178.87 | |||
| 2 | CV-assisted | 58 | 858.34 | 295.88 | 782.19-934.49 | 0.445 | |
| Traditional | 60 | 815.98 | 303.76 | 739.12-892.84 | |||
| 3 | CV-assisted | 67 | 784.07 | 310.77 | 709.66-858.48 | 0.659 | |
| Traditional | 66 | 763.38 | 220.97 | 710.07-816.69 | |||
| 4 | CV-assisted | 70 | 766.31 | 245.92 | 708.7-823.92 | 0.868 | |
| Traditional | 65 | 759.23 | 248.09 | 698.92-819.54 | |||
| 5 | CV-assisted | 69 | 710.52 | 198.3 | 663.73-757.31 | 0.84 | |
| Traditional | 68 | 716.62 | 150.43 | 680.87-752.37 | |||
| Total | CV-assisted | 70 | 807 | 183.87 | 763.93-850.07 | 0.669 | |
| Traditional | 68 | 794.19 | 167.34 | 754.42-833.96 | |||
| - | Grade total | ||||||
| - | 1 | CV-assisted | 49 | 1055.77 | 236.83 | 989.46-1122.08 | 0.903 |
| Traditional | 48 | 1062.49 | 302.78 | 976.83-1148.15 | |||
| 2 | CV-assisted | 68 | 871 | 231.7 | 815.93-926.07 | 0.769 | |
| Traditional | 66 | 882.49 | 220.6 | 829.27-935.71 | |||
| 3 | CV-assisted | 70 | 774.78 | 208.08 | 726.03-823.53 | 0.343 | |
| Traditional | 68 | 810.37 | 230.75 | 755.52-865.22 | |||
| 4 | CV-assisted | 70 | 760.11 | 205.52 | 711.96-808.26 | 0.866 | |
| Traditional | 68 | 754.89 | 151.92 | 718.78-791 | |||
| 5 | CV-assisted | 70 | 734.46 | 181.2 | 692.01-776.91 | 0.865 | |
| Traditional | 68 | 739.54 | 168.01 | 699.61-779.47 | |||
| - | Grand total | ||||||
| - | - | CV-assisted | 70 | 801.94 | 171.88 | 761.67-842.21 | 0.599 |
| Traditional | 68 | 816.43 | 149.93 | 780.79-852.07 | |||
Abbreviations: MW, male white; MB, male black; FW, female white; FB, female black.
Next, the effect of the models' gender on emotion labelling was analyzed. It was found that male participants were more likely to label female-neutral expression photos as happy than male-neutral expression photos (p = 0.04). Additionally, all participants, except the engineering students, showed a stronger tendency to label females’ minimal sad photos as happy, but the difference in males’ photos was not statistically significant. Conversely, when the male models exhibited minimal happiness (grade 1), all participants tended to label them as neutral. Compared to the females’ photos, this tendency was significantly higher when the photos were analyzed overall (p < 0.001) and in all the other categories of participants too (Females: p = 0.014, Males: p < 0.001, Medical students: p < 0.001, and Engineering students: p < 0.009). Further, when the level of happiness expression among male models exceeded 1, this behavior was not observed in practice. Thus, mislabelling usually occurred when the models’ (of either sex) expressions were minimal or neutral. However, there was no significant difference in the proportion of correct responses in happiness recognition between participants by sex, even when viewing minimal expressions. Similarly, with respect to the time required for recognizing happiness, no consistent pattern was observed based on either the model's sex in the photos or the participants' sex.
Regarding performance on photos with sad expressions, the time to recognize them was considerably longer than for happy expressions. Statistically, the difference was significant overall (p < 0.001) and within the subcategories. It was significant in both the control and intervention phases of both the CV-assisted and the traditional groups. Between the traditional and CV-assisted groups, participants in the latter group took longer to recognize sadness, though the difference was not statistically significant. Compared to the control phase, the time required to recognize sadness post-intervention had uniformly reduced in both the CV-assisted and traditional groups. The difference was even statistically significant overall (CV-assisted group: p = 0.047, traditional group: p = 0.005) and in the sub-groups of males (CV-assisted group: p = 0.03, traditional group: p = 0.015) and engineering students (CV-assisted group: p = 0.003, traditional group: p = 0.023).
Participants’ expressions were analyzed using CV, regardless of group membership. It provided a score indicating how genuine the happy expression was perceived to be by the CV system. It was found out that the mean scores were significantly higher for the CV-assisted group than the traditional group (p < 0.001). When the mean scores were compared between the control and intervention phases, the latter showed significantly higher scores (p < 0.001) in both the CV-assisted and traditional groups. However, no positive correlation was found between CV scores and participants’ speed of emotion recognition. Pearson correlation coefficient for the CV-assisted group was –0.1, and for the traditional group, it was -0.2. On the other hand, there was no negative correlation found between reaction times and error rates either; r = 0.4 for both groups. Finally, after completing their trials, participants were asked whether they could guess the study's actual purpose; none answered correctly.
4. DISCUSSION
This study aimed to determine whether computer vision is a more effective tool than traditional methods for increasing happiness among research participants. Among the participants, there was a healthy balance of both sexes and students from two different academic backgrounds: medical and engineering. Even though they were all chosen from two educational institutions, they were not associated with any known confounding factors that would twist the results when compared to the general population. It has been shown that decreased sensitivity to bodily feedback with age hampers the capacity to recognise others' and one's own emotions [25]. With emotion recognition being the task of primary importance in this study, the participants chosen can be considered as young adults, with their age ranging from 18 to 35 years.
The CV scores of both the CV-assisted and traditional groups showed almost no correlation with performance in emotion recognition speed. Nonetheless, participants in the traditional group, who were instructed to bite a pen, labelled emotions consistently faster than during the control phase. It has been shown that holding a pen in the mouth increases an individual’s happiness and helps them better recognize it in others [6]. Post-intervention, the traditional group had more correct responses when labelling happy faces than the CV-assisted group. Recognition of happy faces is found to be directly proportional to the happiness generated in some studies [13]. Here, it means that the traditional method of biting on a pen might have induced a higher level of happiness than the CV assistance, and this inference is of primary importance to this study.
Even though some recent studies [5] have not replicated the effect of the facial feedback hypothesis, subsequent studies have [26]. Coles et al. [27] conducted a multi-lab study with approximately 4000 participants spanning 19 countries, which showed the effect of the facial feedback mechanism when using mimicry and a voluntary facial action task. They demonstrated the effect even with the pen-in-mouth technique, but the evidence was less conclusive. A recent study examined the effect of pen-in-mouth manipulation on perception of emotional faces and memory [28]. The manipulation did not affect memory, but the perception of happy faces improved consistently.
As described above, control of one emotion is possible through the expression of another. Conversely, Rychlowska et al. [18] proved that even without expressing a new emotion, the restriction of facial muscle movements can reduce the speed at which emotions are labelled. In the present study, the control phase, during which the restriction was imposed, showed significantly slower emotion recognition and fewer correct responses than the post-intervention phase in both the CV-assisted and traditional groups. Thus, the control phase significantly impaired participants' emotion recognition.
In the present study, happiness was recognized faster than sadness. This is in line with the existing literature, which establishes that individuals tend to recognize emotions that are congruent with their current emotional state of mind. However, in the control phase, when no emotions were expressed, recognition of happiness remained significantly faster. This finding is consistent with the happy categorization advantage [29], which states that happy emotions are recognized faster than other emotions. One reason for this phenomenon is that a happy facial expression shows fewer overlapping changes with other expressions [30]. Instead of a complete analysis of the face, just a salient feature is enough for its identification [31]. Also, people are positively biased about reality and are even in a positive mood most of the time. Thus, expectations and mood play a role in this advantage [29]. Additionally, in the presence of emotions of negative valence, there is a biased reallocation of resources away from higher-order cognitive processing [32]. These can explain the significant differences in reaction times for sadness and happiness.
Regarding the sex of faces, participants have been shown to find female faces happier than male faces [10]. The reason can be traced back to the fact that boys and men are found to be involved in more certain types of aggressive behaviour than girls and women. This itself might be shaped partly by society wherein the aggression by a male is tolerated more [33]. In the present study, neutral expressions of female faces were mislabelled as happy, especially by male participants. Most participants labelled even the minimal sad faces of females as happy and, conversely, labelled the minimal happy faces of males as neutral. Regarding the time it takes participants to recognize emotions, it has been repeatedly shown that males are slower than females [34]. Along with the biological differences between the two sexes, the social upbringing of females can also be ascribed to this, wherein they are encouraged to perceive and express emotions more than males. However, in this study no significant difference in either the speed of recognition or the proportion of correct responses was found based on the sex of the participants.
It is widely believed and quite often proven that as speed increases while performing tasks, more mistakes happen; this is referred to as the ‘speed accuracy trade-off’. In this study, there was no negative correlation between emotion labelling accuracy and reaction time. It is suggested that the pressure under which an individual performs a task makes them more prone to mistakes, not just the speed of performance. Participants would have been under pressure if they had reference values for the expected speed of performance, based on previous experience [35]. The participants in this study might have acted comfortably, without any pressure, as there were no such reference values, nor had they engaged in a similar task previously. This might be the reason why the speed-accuracy trade-off did not exert its influence in this study.
5. STUDY LIMITATIONS
Compared with the control phase, emotion recognition in the intervention phase was significantly improved for both happiness and sadness. As an attempt was made to generate only happiness during the intervention, the congruent emotion (happiness)- related photos were supposed to gain an advantage over other emotions. This may be explained by the fact that the participants had already completed the control phase and were more comfortable with the given task during the intervention phase. Even though this problem was foreseen, it could not be prevented as the intervention phase could not have come before the control phase. The fixed within-subject order and the lack of counterbalancing can be viewed as threats to internal validity.
It is well known that the timed behavioural processes, such as emotion recognition, can be affected by attention and motivation [37]. Even though the participants appeared motivated by the possibility of winning a cash prize, the same cannot be assumed of their attention. This is more valid in the case of the CV-assisted group, as participants were given repeated prompts based on computer vision scores to encourage and maintain a smile. This process, though it undoubtedly improved the CV scores provided for participants’ genuineness in happiness expression, might also have inadvertently caused distraction, thereby hampering participants' performance in the CV-assisted group. This might be one of the reasons why the traditional group performed with a higher proportion of correct responses.
5.1. Future Work
To compare the efficiency of computer vision against the traditional methods using a non-intrusive approach, where participants will not be disturbed during the trials. When happy expressions were analysed using computer vision, the scores in the CV-assisted group were significantly higher than the other. Consequently, more happiness should have given rise to better performance, but it did not. This might be because the distraction to the participants brought the performance down, or, simply put, less genuine expressions from the participants fooled the computer vision. To be fair, even humans are not completely immune to being deceived by such expressions. The future study on similar lines can aim to employ computer vision systems that are more precise. Also, the models in the set of photos used for testing can be from multiple races.
CONCLUSION
If one is not feeling happy, but still, if that person can generate happiness from within by giving appropriate expressions, it would be beneficial, especially if that person has an illness such as clinical depression. Just as in laughter therapy, where the ‘fake it until you make it’ principle [36] is followed by intentionally laughing out loud; in this study, too, forceful smiling was the action under focus. It was found that the computer vision-guided approach to smiling was inferior at generating happiness compared to the traditional method of biting a pen. Suppose the simple traditional method is the better of the two; still, we should not forget what this study was meant for: the need for uniform, practical guidelines for generating a smile as genuine as possible. If this requirement is met, then the simpler method of displaying a smile can be useful in generating happiness among some of those in need.
AUTHOR'S CONTRIBUTIONS
Conceptualization, methodology, software, validation, formal analysis, investigation, resources, data curation, writing-original draft preparation, writing-review and editing, visualization, supervision, and project administration were performed by the author A.S.
LIST OF ABBREVIATIONS
| FFH | = Facial Feedback Hypothesis |
| CV | = Computer Vision |
| WHO | = World Health Organization |
| MSFDE | = Montreal Set of Facial Displays of Emotion |
| FACS | = Facial Action Coding System |
| API | = Application Program Interface |
| ms | = Milliseconds |
| FB | = Female-Black |
| FW | = Female-White |
| MB | = Male-Black |
| MW | = Male-White |
| N/A | = Not available |
ETHICS APPROVAL AND CONSENT TO PARTICIPATE
This study was approved by the Institutional Ethics Committee of Father Muller Medical College, India (protocol code - FMIEC/CCM/263/2022, date of approval- 06/05/2022).
The two images of humans included in this manuscript have been obtained from ‘Canva.com’ after purchasing their ‘Pro Content’ license.
HUMAN AND ANIMAL RIGHTS
All procedures involving human participants were conducted in accordance with the ethical standards of the committee responsible for human experimentation (institutional and national), and with the Helsinki Declaration of 1975, as revised in 2013.
CONSENT FOR PUBLICATION
Informed consent for participation was obtained from all the subjects involved in the study.
AVAILABILITY OF DATA AND MATERIALS
The data supporting the findings of the article is available in FigShare at https://doi.org/10.6084/ m9.figshare.29673518.
ACKNOWLEDGEMENTS
The author wants to express his sincere gratitude and thanks to the following:
- Vineetha V. Shetty, Department of OBG, KMC, Mangalore and Anissa Mary Thomas Thattil, Department of Community Medicine, FMMC, Mangalore for revising the manuscript.
- Father Muller Research Centre for their financial support towards publishing costs.
- Sucharitha Suresh, Department of Community Medicine, FMMC, Mangalore, for helping with the statistical analysis.
- Rest of the teaching faculty of the Department of Community Medicine, FMMC, Mangalore, for their timely guidance.