All published articles of this journal are available on ScienceDirect.

Attitudes Towards Traffic Safety Worldwide
Abstract
Background:
There is agreement that road user behaviour is the most important contributing factor for traffic accidents. It is therefore essential to understand better the causes of accidents and design remedies that can efficiently treat them. The fatality rate per 10,000 people is about 30 times higher in developing countries than in high-income countries These differences, beside other factors, can be explained in terms of different traffic safety cultures.
Objective:
The general mission of this work was to contribute to traffic safety by gaining an understanding of the differences in traffic culture in countries worldwide. Furthermore, we sought to explore and understand the needs and beliefs concerning traffic safety in different countries worldwide and the implications for the objective traffic safety situation (Traffic Safety Index – TSI) and for the stage of the economic development of the country (Gross Domestic Product – GDP).
Methods:
A simple questionnaire with three questions focused on beliefs and opinions about traffic safety was used. Altogether, 142 respondents from 36 countries filled in the questionnaire. The data was analysed using both statistical methods and qualitative analysis of the responses.
Results:
The results indicated major differences in the traffic safety cultures embraced by different countries. In general, two approaches to traffic safety culture can be identified. In the first case, traffic safety culture is viewed as an objective reality which the respondents conceive of as leading to greater safety. The second case involves the emphasis being placed particularly on the elimination of a threat to life and health.
Conclusion:
People from countries with a poorer traffic safety record tend to underline the importance of traffic safety. No evidence of a relationship between the economic performance of the country (GDP), the traffic safety culture standard, and the Traffic Safety Index was found. Finally, the implications of the results for practice are discussed with a view to the practical implementation of measures to improve traffic safety.
INTRODUCTION
There is agreement that road user behaviour is the most important contributing factor for traffic accidents. It is therefore essential to understand better the causes of accidents and design remedies that can efficiently treat them. Traffic safety culture takes the term “understanding” a step further by not only asking what the factors are which can be associated with traffic accidents but also why people engage in behaviours which increase their risk of being involved in an accident.
According to Wiegmann et al. [1], “safety culture is the enduring value and priority which refers to the extent to which individuals and groups commit to personal responsibility for safety, act to preserve, enhance, and communicate safety concerns”. Traffic safety culture is a concept with which to explain observed differences in crash risks, as well as the propensity to engage in high-risk behaviours [2].
The aim of this study was to explore and understand the needs and beliefs concerning traffic safety worldwide and the implications for the objective traffic safety situation in each country (Traffic Safety Index – TSI) and for the stage of the economic development of the country (Gross Domestic Product – GDP). A more general mission was to contribute to traffic safety by gaining an understanding of traffic-specific cultural differences.
LITERATURE REVIEW
The fatality rate per 10,000 people is about 30 times higher in developing countries than in high-income countries [3]. The developing countries bear a very high share of traffic accidents and fatalities relative to the number of kilometres driven per year [4]. Moreover, 96% of all fatal traffic accidents which include children happen in the developing countries [5]. In comparison to the high-income countries, traffic accidents in the developing countries include much more pedestrians and vulnerable road users in general. These differences, beside other factors, can be explained in terms of different traffic safety cultures.
Human behaviour is the main or contributing factor for about 90% of all traffic accidents [6]. Road users are influenced by their internal state which predisposes them to act in one way or another. These can be described as stable and transient factors. Examples of stable trait factors are; personality and to some extent attitudes and personal norms. Transient state factors are state of fatigue; consumption of alcohol, drugs, or medication; influence of stress and aggressiveness. These factors are also influenced by the environment to a greater or lesser extent. This means that one person might exhibit different behaviour if the inner or outer circumstances change. It could therefore be argued that road users´ behaviour should not be studied in isolation since they are also influenced by their surroundings, including culture. Without doubt every person is socialised by the culture he or she lives in and will behave as a part of that society.
Following a thorough analysis of literature, the “4 E’s approach” (Education, Enforcement, Engineering and Evaluation) may serve as a starting point when discussing possible improvements, or accident countermeasures. But evidence shows that this traditional approach is not fully successful (e.g [7-10]).
Hence, in order to understand road user behaviour we need to look at any pertinent interpersonal, social, cultural factors and associated context. Furthermore, we also need to understand how different components of the traffic system, including those explicitly meant to increase safety, interact with human behaviour. To this end we need to study the effects of traffic safety culture on road users’ behaviour.
The role of cultural influences on the traffic safety has been documented only scarcely. Recent research - mostly done in Scandinavia - related to licencing procedure suggests that lifestyle and cultural background of drivers are closely connected to their behaviour in traffic. Thus we suppose that the cultural background affects the lifestyle of drivers and, consequently, has an impact on strategic thinking, communication with other road users, vehicle control and handling issues. How the car is seen in society, how representatives of authorities and public institutions discuss car use and how media treat it. The effects of the cultural background on driving a car are of big importance.
Changes in driver behaviour such as increased seat belt use and reduced alcohol-impaired driving meant significant improvements in the 1980s. Thereafter, traffic safety began to deteriorate, presumably because of a change in conditions that abandoned prior trends of safe behaviours and increased dangerous behaviour. It has been argued that the improvement of roads results in a reduction in the perception of traffic risk [11]. Improvements to roads and cars may actually cause an increase in traffic accidents because drivers increase their speed and are less careful. The problem of speeding might be a good example of the influence of a traffic safety culture on driver behaviour. According to the National Highway Traffic Safety Administration [12], speeding is one of the most prevalent risk factors, contributing to approximately 30% of all fatal traffic crashes in the U.S. In 2011, speeding was a contributing factor in 30.7% of all fatal crashes, and 9,944 lives were lost in speeding-related crashes. In other countries the figure is not significantly different. The prevalence of speed as a risk factor can be used as evidence that our societies are characterised by a traffic safety culture that motivates and condones speeding. Many traffic cultures perceive speeding not as risky but as a behavioural norm.
MATERIALS AND METHODS
Questionnaire and Data Collection
Data was collected using a simple questionnaire. It contained three questions which focused on beliefs and opinions about traffic safety, specifically:
- What does traffic safety mean to you? (open question)
- How much money should be spent on improving traffic safety? (answers: none/a little/a reasonable amount/whatever is needed)
- How should people change their behaviour in order to improve traffic safety? (open question)
The questions were formulated according to and based on the opinion of traffic safety experts and were developed within the Traffic Psychology Working Group during the spring of 2014.
The questionnaire was then piloted on a small group of respondents (approximately 50) and feedback was collected to ensure that the questions were clearly articulated and correctly understood. The next step was the translation of the items into the languages that are widely spoken in the world, specifically Italian, Swedish, German, Spanish, Portuguese, French, Chinese, Arabic, Russian, and Hindi (with three additional languages – Slovak, Czech, and Polish – being added). Subsequently, using Google Forms, a questionnaire form was prepared and published online on the Palacky University website.
The data was collected during the summer and autumn of 2014 using the snowball method and direct addressing via email. Most of those who were addressed were professionals in the field of traffic safety (e.g. TPI – Traffic Psychology International, CIECA – The International Commission for Driver Testing, ICTCT – International Cooperation on Theories and Concepts in Traffic Safety).
Sample
In the questionnaire we did not ask the respondents for any demographic information. Given the data collection process, we can assume that the respondents were traffic safety professionals. The other information that we have about the respondents is the name of the country where they spend most of the year.
Altogether, 142 respondents filled in the questionnaire (fully completed questionnaires – the respondents were requested to fill in all the fields). The numbers of respondents by country are shown in Table 1.
Number of respondents for each country.
| Country | Count |
|---|---|
| Saudi Arabia | 15 |
| USA | 15 |
| Germany | 11 |
| Austria | 9 |
| Finland | 9 |
| Latvia | 8 |
| Netherlands | 6 |
| France | 5 |
| Poland | 5 |
| Spain | 5 |
| Sweden | 5 |
| Italy | 4 |
| United Kingdom | 4 |
| Brazil | 3 |
| Canada | 3 |
| Estonia | 3 |
| Norway | 3 |
| Romania | 3 |
| Switzerland | 3 |
| Australia | 2 |
| Belgium | 2 |
| Denmark | 2 |
| India | 2 |
| Ireland | 2 |
| Portugal | 2 |
| Bosnia-Herzegovina | 1 |
| Czech Republic | 1 |
| Greece | 1 |
| China | 1 |
| Israel | 1 |
| Kiribati | 1 |
| Luxembourg | 1 |
| Philippines | 1 |
| Russia | 1 |
| Seychelles | 1 |
| Slovakia | 1 |
For the data analysis we decided to group these responses into bigger groups according to geopolitical and traffic safety situations. In some cases more groups were drawn together in order to ensure that there were enough responses within a group for statistical analysis. The groups were defined as follows:
- North America and Australia
- Europe
- Others/Rest of the world
Within Europe, we established the following subgroups:
- Western Europe (Austria, Belgium, France, Germany, Ireland, Luxembourg, Netherlands, Switzerland, United Kingdom)
- Northern Europe (Denmark, Finland, Norway, Sweden)
- Southern Europe (Bosnia and Herzegovina, Greece, Italy, Portugal, Spain)
- Eastern and Central Europe (Czech Republic, Estonia, Latvia, Poland, Romania, Slovakia)
Data Analysis
Both statistical methods and qualitative analysis of the responses were used for the data analyses. For the qualitative analysis, the answers to Questions 1 and 3 were translated into English and the texts were further treated according to the sociological tradition in which qualitative data is regarded as a window into human experience [13]. The data was analysed systematically using a modified version of the Editing Analysis Style [14]. Our study applied thematic analysis as a tool for pattern recognition across qualitative data.
The statistical analysis was conducted using a Kruskal-Wallis H test in order to determine any differences in the Q2 answers between selected groups. Pairwise comparisons were performed using Dunn's procedure with a Bonferroni correction for multiple comparisons.
Data from the year 2013 as stated in the Global Status Report on Road Safety 2013: Supporting a Decade of Action, published by the WHO [4], was used as a Traffic Safety Index (TSI). The index was calculated as the ratio of road fatalities relative to 100,000 inhabitants.
Gross Domestic Product (GDP) was used as an indicator of economic development. We used the 2013 data from the International Monetary Fund [15].
RESULTS
The results will be presented in two sections, according to the methods of analysis – qualitative and quantitative. The first question (What does traffic safety mean to you?) and the third question (How should people change their behaviour in order to improve traffic safety?) were open questions and so they will be analysed on a qualitative basis, using text analysis. The second question (How much money should be spent on improving traffic safety?) was a multiple-choice question (answers: none/a little/a reasonable amount/whatever is needed) and, accordingly, will be analysed using statistical methods.
Quantitative Analysis
The respondents answered a simple question (Question 2 – How much money should be spent on improving traffic safety?) by choosing one of the following responses: none/a little/a reasonable amount/whatever is needed. Using statistical analysis, we were looking for differences among different groups of countries (as described earlier in the paper) and correlations with the Traffic Safety Index and Gross Domestic Product. The countries from which we received responses were categorised as follows:
- North America and Australia;
- Europe (within Europe, we established the following subgroups: Western Europe, Northern Europe, Southern Europe, and Eastern and Central Europe);
- Others/ Rest of the world.
The Traffic Safety Index (TSI) was calculated as the ratio of road fatalities relative to 100,000 inhabitants. As an indicator of economic development, Gross Domestic Product (GDP) was used.
To summarise, the preferences for specific answers differed significantly from region to region (Western, Eastern, Northern, and Southern Europe, North America and Australia, and Others/Rest of the world) (χ2 = 24.477; p < 0.001). For multiple comparisons, adjusted p-values are presented. There were significant differences between:
- Northern Europe and Southern Europe (p = 0.028);
- Northern Europe and Western Europe (p = 0.031);
- Northern Europe and Others/Rest of the world (p < 0.001).
The differences between Northern Europe and Eastern Europe and between North America and Australia and Others/Rest of the world were just slightly above the statistical significance level. The respondents from Northern Europe mostly chose the “reasonable amount” answer, while the other regions opted for “whatever is needed” (Table 2, Fig. 1).
Counts of answers to Question 2 (How much money should be spent on improving traffic safety?).
| Region | None | A Little | A Reasonable Amount | Whatever is Needed | N |
|---|---|---|---|---|---|
| North America and Australia | 0 | 0 | 12 | 8 | 20 |
| Western Europe | 0 | 2 | 16 | 25 | 43 |
| Southern Europe | 0 | 1 | 2 | 9 | 12 |
| Eastern Europe | 1 | 0 | 8 | 12 | 21 |
| Northern Europe | 0 | 0 | 16 | 2 | 18 |
| Others/Rest of the world | 0 | 0 | 4 | 21 | 25 |
| Total | 1 | 3 | 58 | 77 | 139 |
The bar charts and Boxplot in Fig. (1) and Fig.(2) indicate that while the “whatever is needed” answer seemed to be preferred by the respondents in the countries of Southern Europe and the rest of the world, “a reasonable amount” predominated in Northern Europe (and in North America and Australia for that matter). There are no major differences between the west and the east of Europe, with the “whatever is needed” answer slightly predominating in those.
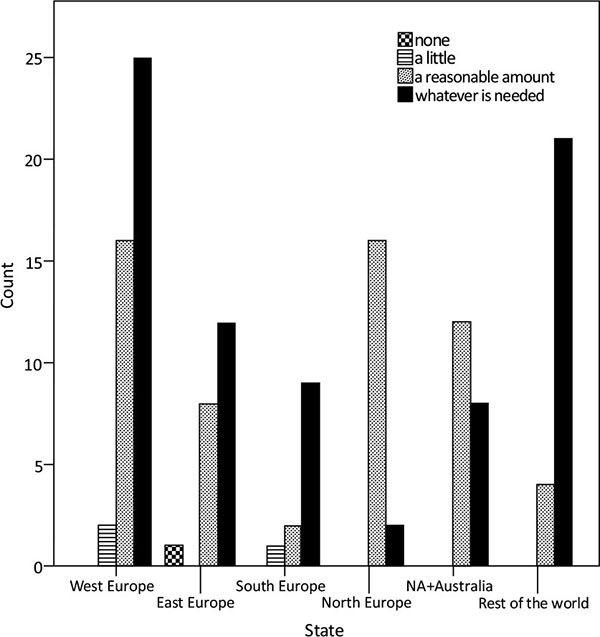
Counts of answers to Question 2 (How much money should be spent on improving traffic safety?).
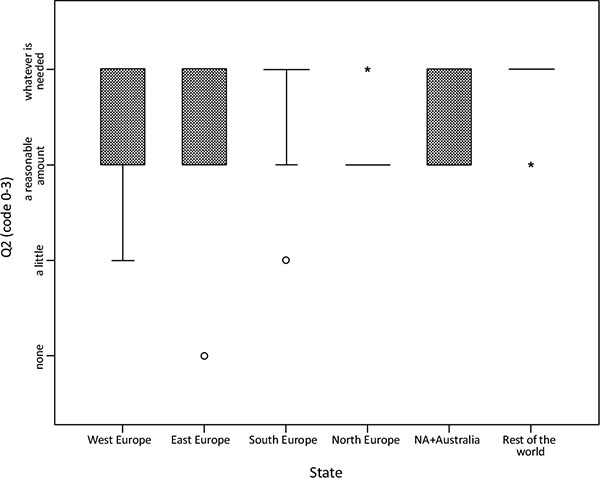
Boxplot-distributions of Q2.
While no relationship was found between the answers to Question 2 and the GDP of the country (r = 0.018; p = 0.830), there appears to be a moderate positive correlation between the answers to Question 2 and the TSI of the country under consideration (r = 0.320; p < 0.001) (Fig.3). People coming from the countries with a higher TSI (the ratio of road fatalities relative to 100,000 inhabitants, i.e. the higher the index, the lower the traffic safety in the given country) were more likely to choose the “whatever is needed” answer than “a reasonable amount” or less. This is particularly the case with the respondents from Saudi Arabia, Brazil, China, Russia, Bosnia and Herzegovina, and the Seychelles.
For the purposes of the next step, statistical processing (to look for any relationship between the GDP and the TSI), each country was included in the respective region only once to prevent data bias caused by various numbers of participants from different countries; the indices under study relate to the countries, not the participants. At the same time, the countries of the research participants are taken into account, not all the countries of the world/Europe. The total number of countries was 36.
In view of the presence of outliers (U.S. GDP > USD 16,000 million), Spearman rank correlation was used. Nevertheless, the correlation coefficient (r = -0.061; p = 0.723) shows that there is no statistically significant relationship between the Gross Domestic Product (GDP) indicator and the Traffic Safety Index (TSI). As seen in the scatter chart (Fig.4), countries with a low GDP also often show a relatively low rate of road fatalities and, on the other hand, countries with a higher GDP may report a higher rate of people killed in traffic accidents. However, nothing of the above applies to all the countries.
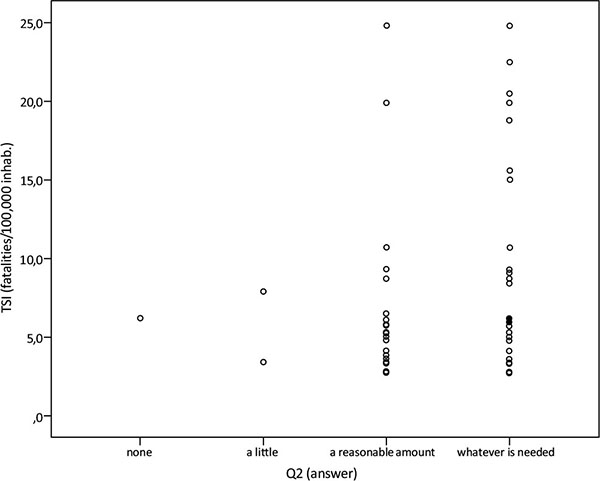
Answers to Question 2 and TSIs of the countries.
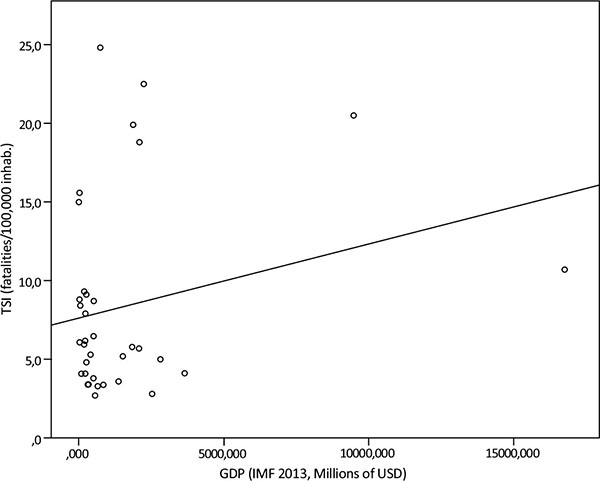
Relationship between the GDP and the TSI of the countries.
Furthermore, we compared the Traffic Safety Index across different parts of the world – Western, Eastern, Northern, and Southern Europe, North America and Australia, and Others/Rest of the world (mostly Asian countries and Saudi Arabia). While a normal distribution of the dependent variable was recorded in the groups (Shapiro-Wilk test, p > 0.05 in each group), the variance homogeneity condition was not met (Levene Statistic = 6.341; p < 0.001). Therefore, the Brown-Forsythe test was used to make the comparison. It identified differences in the average number of road fatalities recorded for the individual parts of the world (F = 8.849; p < 0.001).
Post-hoc tests using Dunnett’s T3 procedure for non-homogeneous variances discovered differences especially between Western Europe and Others/Rest of the world (non-European countries, excluding North America and Australia) (p = 0.031) and Northern Europe and Others/Rest of the world (p = 0.018) (Fig. 5).
One can notice here that the countries of Eastern and Southern Europe show slightly greater variance in their TSIs than the countries of Western and Northern Europe and that the median TSIs of the countries of Eastern and Southern Europe lie above those recorded for the countries of Western and Northern Europe. However, post-hoc tests revealed no statistical significance of this difference (p > 0.05) (Table 3).
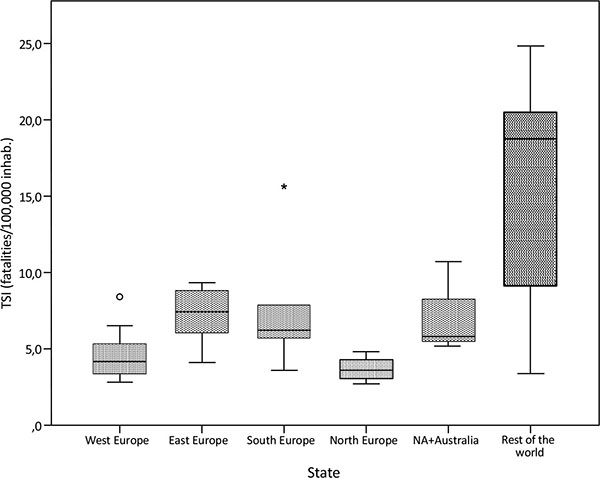
Boxplot – groups of countries by TSI.
Multiple comparisons of TSI (fatalities/100,000 inhabitants) by groups of states.
| (I) Region | (J) Region | (I-J) Mean Difference | Std. Error | Sig. | 95% Confidence Interval | |
|---|---|---|---|---|---|---|
| Lower Bound | Upper Bound | |||||
| Western Europe | Eastern Europe | -2.4333 | 1.0262 | .353 | -6.229 | 1.362 |
| Southern Europe | -3.0333 | 2.1505 | .863 | -13.272 | 7.205 | |
| Northern Europe | 1.0917 | .7375 | .856 | -1.583 | 3.766 | |
| NA + Australia | -2.4667 | 1.8401 | .869 | -16.017 | 11.084 | |
| Rest of the world | -10.7889* | 2.6191 | .031 | -20.703 | -.875 | |
| Eastern Europe | Western Europe | 2.4333 | 1.0262 | .353 | -1.362 | 6.229 |
| Southern Europe | -.6000 | 2.2303 | 1.000 | -10.617 | 9.417 | |
| Northern Europe | 3.5250 | .9453 | .071 | -.268 | 7.318 | |
| NA + Australia | -.0333 | 1.9328 | 1.000 | -12.232 | 12.165 | |
| Rest of the world | -8.3556 | 2.6850 | .123 | -18.312 | 1.601 | |
| Southern Europe | Western Europe | 3.0333 | 2.1505 | .863 | -7.205 | 13.272 |
| Eastern Europe | .6000 | 2.2303 | 1.000 | -9.417 | 10.617 | |
| Northern Europe | 4.1250 | 2.1131 | .607 | -6.294 | 14.544 | |
| NA + Australia | .5667 | 2.7032 | 1.000 | -11.122 | 12.256 | |
| Rest of the world | -7.7556 | 3.2835 | .342 | -19.420 | 3.909 | |
| Northern Europe | Western Europe | -1.0917 | .7375 | .856 | -3.766 | 1.583 |
| Eastern Europe | -3.5250 | .9453 | .071 | -7.318 | .268 | |
| Southern Europe | -4.1250 | 2.1131 | .607 | -14.544 | 6.294 | |
| NA + Australia | -3.5583 | 1.7963 | .628 | -18.116 | 10.999 | |
| Rest of the world | -11.8806* | 2.5885 | .018 | -21.798 | -1.963 | |
| NA + Australia | Western Europe | 2.4667 | 1.8401 | .869 | -11.084 | 16.017 |
| Eastern Europe | .0333 | 1.9328 | 1.000 | -12.165 | 12.232 | |
| Southern Europe | -.5667 | 2.7032 | 1.000 | -12.256 | 11.122 | |
| Northern Europe | 3.5583 | 1.7963 | .628 | -10.999 | 18.116 | |
| Rest of the world | -8.3222 | 3.0891 | .232 | -19.906 | 3.261 | |
| Rest of the world | Western Europe | 10.7889* | 2.6191 | .031 | .875 | 20.703 |
| Eastern Europe | 8.3556 | 2.6850 | .123 | -1.601 | 18.312 | |
| Southern Europe | 7.7556 | 3.2835 | .342 | -3.909 | 19.420 | |
| Northern Europe | 11.8806* | 2.5885 | .018 | 1.963 | 21.798 | |
| NA + Australia | 8.3222 | 3.0891 | .232 | -3.261 | 19.906 | |
Qualitative Analysis
For the qualitative analysis, the answers to Questions 1 and 3 were translated into English. The data was analysed systematically using a modified version of the Editing Analysis Style [14]. Our study applied thematic analysis as a tool for pattern recognition across qualitative data.
Question 1: What Does Traffic Safety Mean to you? All Responses (All Countries) (N =142 Responses).
The answers of the probands from North America and Australia to the question What does traffic safety mean to you? could be categorised into four groups. The largest number of the probands (eight) considered that traffic safety mainly involved instruments and activities aimed at reducing the accident rate (e.g. “any measures pertaining to the infrastructure and behaviour that reduce the possibility of an accident”). For the second largest group of the respondents (seven), traffic safety meant “not to be jeopardised”, i.e. fewer accidents, injuries, and deaths; e.g. “fewer fatalities, injuries, and accidents with the involvement of a motor vehicle (including motor vehicles colliding with cyclists, pedestrians, and motorcyclists)”. Three people viewed safety as the proper behaviour and interaction of road users (e.g. “Traffic safety means what is happening on public roads, whether they are local gravel roads or an international highway network. Traffic safety covers all that is happening in a car on the road”). The previous categories did not fit two persons only (e.g. “signs of driving culture”).
The above categories of the notions of safety were also found in the probands from other parts of the world. In Europe, the largest number of people (45) considered that traffic safety implies the absence of a threat to health or life and a sense of security (e.g. “the possibility of moving from place A to place B without an accident; the most important aspect is to eliminate any fatalities or injuries. As a road user, I need to be sure that I get to where I want to in one piece.”). The second most common notion of road safety (17 individuals) was that of an instrument or activity leading to a reduction in the accident rate (e.g. “a body of rules, sources, and ideas that help fulfil the purpose of both public and private transport while minimising its impact on people’s health. Rules refer to education, legislation, and information; resources and ideas to funding, technologies, investment, planning, and prevention, and health implies both physical and mental health and good health status”). 14 people had a different personal notion of safety or provided a very unclear response to the question (e.g. “a safe option for everybody to keep their mobility independent of their age and obstacles” or “equality of all road user groups and safety for vulnerable road users”). The lowest rate (five persons) was recorded for responses in which the probands referred to traffic safety as the proper behaviour and interaction of road users (e.g. “traffic safety is more about the responsible behaviour of drivers and pedestrians on roads; it is not always so important to strictly adhere to traffic rules”). Slightly more people (10) regarded traffic safety as a combination of multiple notions, often in relation to their occupational background (e.g. “Traffic safety – ideal collective designing of traffic to prevent road accidents, which requires: (1) absolute (steadfast) adherence to traffic rules by ALL ROAD USERS; (2) good condition of roads featuring an elaborate system of signs facilitating the fluency of the traffic flow; (3) a responsible attitude on the part of drivers to the technical condition of their means of transport”).
The notion of safety reported in the remaining parts of the world could also be placed under the above categories. For the largest number of the probands (12), traffic safety meant “not to be jeopardised”, a sense of security, and the protection of life (e.g. “to make a carefree journey from one place to another within a reasonable time and without anybody being jeopardised”). Four persons perceived safety as a combination of multiple notions. The same number of the probands referred to their own personal notion of safety. Three individuals regarded traffic safety as instruments and activities leading to a reduction in the accident rate. Only one participant conceived of safety as the proper behaviour and interaction of road users.
Question 1: What Does Traffic Safety Mean to you? Responses from European States (N = 96 Responses).
In Western Europe, the probands’ answers to the question What does traffic safety mean to you? could be ranked under five categories. The highest number of the probands (17) viewed safety as the absence of a threat to their life and health, as a sense of security (e.g. “a certainty that I can move around within a public space without worrying about being hurt or killed by someone else or hurting or killing someone myself. This certainty that I can feel comfortable when moving around in a public space is of high priority.”). The second largest group (10 people) understood traffic safety as an instrument and activity leading to a reduction in the accident rate (e.g. “targeted professional efforts involving planning, engineering, education, and implementation”). Eight persons reported other individual notions of road safety (e.g. “an essential societal requirement”). Four persons viewed safety as a combination of multiple notions (e.g. “driving without jeopardy to myself or being jeopardised by others, structural measures and the elimination of critical locations, driving safety information for drivers”). Only one proband conceived of safety as the proper behaviour and interaction of road users.
In Northern Europe, too, the notion of traffic safety as the absence of a threat to health and life (14 respondents) predominates. For three individuals safety implied instruments and activities aimed at reducing the accident rate, and only two persons reported other notions of their own.
For the majority of the probands from Southern Europe (six individuals) safety means the absence of a threat to health and life and a sense of security. Half of those probands (three) regarded safety as instruments and activities leading to a reduction in the accident rate. One answer was assigned to each of the following categories: the proper behaviour of road users, other individual notions, and a combination of multiple notions.
As in the other parts of Europe, in Eastern Europe the majority of the respondents (eight) felt that traffic safety implied the absence of a threat to health and life. The second largest group (five persons) viewed safety as a combination of multiple notions. Three persons considered traffic safety to be the proper behaviour and interaction of road users. The same number of the probands conceived of safety in their own distinctive way. Only one person perceived safety as instruments and activities leading to a reduction in the accident rate.
Question 3: How Should People Change Their Behaviour in Order to Improve Traffic Safety? All Responses (All Countries) (N =142 Responses).
The answers of the probands from North America and Australia to the question How should people change their behaviour in order to improve traffic safety? could be divided into seven categories. The largest number of the probands (six) stated that a combination of multiple approaches and changes, including the observance of the rules, caution, and protective devices, was needed: for example “(1) adhere to the traffic regulations, (2) drive carefully, and (3) use safety elements that are readily available (such as safety belts and helmets)”. Three persons highlighted the driver’s role in improving safety, i.e. that their responsibility and skills need to be addressed (e.g. “a driver must understand and practice their driving-relevant social skills and understand the risk management strategies pertaining to the development of the skills”). The same number of individuals noted that responsibility on the part of all road users is imperative (e.g. “assume responsibility for their behaviour, show respect and consideration for others”). Additionally, three persons found it appropriate to change the system or traffic environment in order to improve safety (e.g. “We, engineers, should reshape the environment in such a way as to prevent people who act normally from suffering serious injuries.”). A smaller number of the probands (two) found it essential to avoid speeding in order to achieve better road safety (e.g. “understand the importance of safe speed – I believe that the relationship between speed and the length of the journey should be explained to the public”). The same number of individuals thought that safety could be increased by the utilisation of reflective materials (e.g. “learn to wear or carry reflective items when walking outside after dark, at twilight, or dawn!”, “You can see a car, but the driver in that car cannot see you!”, or “Reflective material on a person can be seen at a distance of 500 feet when illuminated by headlights, which helps in reducing the night-time accident rate by half!”). Despite the small number of the probands who expressed such opinions, this point on improving safety is noteworthy, as the probands from the other parts of the world did not mention reflective materials in their responses. Only one proband provided a specific answer of their own.
In Europe, too, the answers could be ranked under the above categories. The largest number of persons (32) found it useful to combine multiple approaches: in addition to the observation of the rules, caution, and protective devices, structural measures, enforcement, and education were mentioned (e.g. “Road users: do not take risks knowingly [in particular, avoid speeding or DUI and use safety devices such as safety belts and helmets at all times]. People involved in the assurance of safety: eliminate the risk of fatal accidents by designing “forgiving” infrastructure, traffic automatisation, and equipping vehicles with safety systems.”). The second largest number of the respondents (18) believed that responsibility on the part of road users should be emphasised (e.g. “consider the presence and behaviour of other people, be prepared for mistakes, and forgive them – avoid insisting on one’s rights in every situation”). Slightly fewer people (11) associated the improvement with the driver and their responsibility and skills (e.g. “avoid selling and using psychotropic substances, ensure that drivers do not engage in such activities (a friend or family member who drives), and be attentive and avoid rushing”). Ten persons saw education as important for the improvement of traffic safety (e.g. “both top-down and bottom-up education, implemented across the population; a model that is participative rather than directive to avoid conflicts between users”). Eight individuals regarded it as necessary to observe the rules and safe speed (e.g. “respecting the regulations and laws when driving, of which the most important is to comply with the legal speed limit and respect all the road signs and signalling”). The smallest number of persons (four) held that a mere change to the system or environment would help (e.g. “prefer public transport [give people a chance to use it]”).
In the other parts of the world, there were also responses that, generally speaking, fell into the above categories. The representation of the groups was relatively even. The largest number of persons (six) found it important to observe the rules. Four individuals held that traffic safety could be improved by changes to the system or environment. The same number of the probands considered education important and four individuals preferred a combination of multiple approaches (rules, caution, enforcement, education, etc). Responsibility on the part of road users was only found important by three probands. The same number of people provided their own distinctive answers.
Question 3: How Should People Change Their Behaviour in Order to Improve Traffic Safety? Responses from European States (N = 96 Responses).
In Western Europe the answer to the question How should people change their behaviour in order to improve traffic safety? could be divided into seven categories. The largest number of the probands (13) stated that it was essential to address the responsibility of individual road users (e.g. “People should pay more attention rather than adopt all kinds of measures. That’s the crucial task. Measures are also important, though. However, no measures can replace the PRIMARY ROLE of road users in assuming the responsibility”). The same number of people thought that multiple approaches must be combined to improve safety (e.g. “People should (1) observe the traffic rules, (2) bear safety in mind, and (3) predict other road users’ behaviour and expect the unexpected.”). A smaller number of the respondents (3) found it appropriate to observe the rules and safe speed (e.g. “Compliance with the basic traffic rules could be enough in this matter. This could be further improved by better “cooperation” of road users.”). The same number of people pointed out the importance of education (e.g. “maintain one’s knowledge about safe participation in road traffic and [physical and mental] fitness [to drive]”). Three individuals also perceived the role of a driver as crucial for improving safety (e.g. “impulsive people must learn self-control strategies and arrogant people must learn that road traffic is not an arena for their showing off. Before getting into a car, each person should ask themselves whether they are capable of driving safely.”). Only one proband believed that a mere change to the system or environment would suffice. Five persons provided different responses of their own (e.g. “refrain from using cars or drive much more slowly than it is the case now, especially within municipal limits; people in cars should be considerate of the people walking on the pavement or riding a bike”).
The respondents from the south of Europe found a combination of multiple approaches to be the most appropriate (five persons). The role of education in improving safety was mentioned as the second most important (four individuals). The necessity of observing the rules, the role of a driver in terms of safety, and another individual response were each stated by one proband.
In Northern Europe, the most frequent responses provided by the probands (eight persons) referred to the need to combine multiple approaches. A smaller number of the probands (three) found it important to address the role and responsibility of the driver. The same number of people brought up the need to change the system or traffic environment. Two persons held that better safety cannot be achieved without observance of the rules and a safe speed, and the same number of individuals felt that the responsibility of the individual road users should be enhanced. One proband only provided a response that differed from any of the above.
In Eastern Europe, too, most of the probands (six) reported that multiple approaches and measures should be adopted to improve traffic safety. The same number of people (six) regarded it as important to address drivers’ responsibilities and abilities. Three people felt that better safety involved responsibility on the part of individual road users. The same number of the respondents found education to be important in this respect. Only two individuals held that to adhere to the rules is enough to improve safety. The same number of people provided another response of their own.
DISCUSSION
The objective of the present research study was to assess the value which people in different parts of the world assign to traffic safety, how important it is to them, and what they think should be changed to improve it. The results are presented against the background of the actual level of traffic safety in the given country (expressed as the “Traffic Safety Index”, i.e. the rate of road fatalities per 100,000 inhabitants) and the level of the country’s economic development, which is defined by the Gross Domestic Product (GDP) indicator.
The limitation of the study which must be considered is the research sample. We do not have any information about the participants, besides the country they chose to be associated with. Given the sampling procedure (purposive selection), we assume that the majority of the sample comprised traffic experts and other professionals in the field. We can only hypothesise how closely their views correspond with the mainstream opinion in the countries under consideration. Keeping this in mind, our study does not have the ambition to reflect the general discourse on attitudes towards traffic safety in these countries. It is rather intended as an outline of the ways in which the concept of traffic safety is perceived there.
The results of the research are presented on the basis of the traffic safety culture theory, which explains differences (while other factors are considered constant) in the perception and behaviour of people in different countries or culturally different regions. Our research tried to cover the traffic safety culture from the following three perspectives:
- to determine what traffic safety means to the respondents by specifically asking them to provide their interpretation of the notion; here the intention was to ascertain what exactly they make of the concept of traffic safety and what value they assign to it;
- what financial resources should be invested to improve traffic safety; the purpose of this question was to establish the degree of importance of traffic safety, or the priority of traffic safety in terms of the overall paradigm of the respondents’ perception of society;
- how people should change their behaviour to improve traffic safety; to a certain extent, this question was articulated as a projective one where a question about the behaviour of others was intended to capture what exactly the respondents thought could help in improving traffic safety.
In line with previous research [16, 17], our study confirmed that people from countries with a poorer traffic safety record (i.e. a higher Traffic Safety Index) assign greater importance to traffic safety. This may be interpreted as an implication of the fact that they find traffic safety a pressing issue which needs to be dealt with using all the means that are available. In comparison with the answers provided by the respondents from countries with a higher standard of traffic safety, where the “a reasonable amount” answers predominated, the “whatever is needed” response was significantly more frequent in these cases.
The literature [18-20] further suggests that the level of economic development of the country has no effect on the importance which the people in the country assign to traffic safety. The results of the present research support such findings. We can conclude that we did not identify any correlation between the level of economic development of the country (GDP) and any of the factors under scrutiny. It should be noted at this point that the relationship between the level of economic development of the country and the level of motorisation (expressed as the number of registered cars per 100,000 inhabitants) is not linear and, therefore, our findings cannot be interpreted in terms of the country’s motorisation rate. Research evidence concerning the relationship between the economic development of a country and the level of traffic safety is not conclusive [19, 20]. Our research did not prove any association between these two factors, either.
A total of two approaches to traffic safety culture can be identified on the basis of the qualitative analysis of the answers to the question What does traffic safety mean to you?. The first emphasises the implementation of effective measures which may lead to the improvement of traffic safety. In this case, in other words, traffic safety culture is conceived of as objective reality, a set of practicalities which the respondents find conducive to greater safety. Specific resources and activities leading to a reduction in the number of accidents and casualties and proper behaviour on the part of people and their interaction were pointed out. Culture is thought of as a reflection and consequence of people’s specific actions and behaviour. The second approach that we have identified highlights especially the feeling of not being jeopardised – the absence of a threat to life or health, a feeling of confidence that one can safely move around a public space without being afraid of being injured or killed by somebody or injuring or killing others. This sense of security when moving around the public space is of high priority. In this respect the perception of traffic safety culture is a subjective phenomenon, with the main emphasis being placed on individual notions of safety.
Again, the answers to the question How should people change their behaviour in order to improve traffic safety? can be divided into two quite distinctive categories. The first category underlines the observance of traffic regulations (with a particular emphasis placed on the observance of speed limits), the strengthening of repressive measures (enforcement of rules), the education and training of drivers, the use of safety elements that are readily available (such as safety belts and helmets), or suitable modifications to the infrastructure aimed at enhancing traffic safety. The respondents appeared to answer this rather specific question in more general terms: when asked what exactly people could change about their behaviour, a relatively large proportion of the respondents answered in a way which only referred very generally to road users’ behaviour or changes in such behaviour. Overall, it can be concluded that especially the areas pertaining to specific formalised traffic-related behaviour (e.g. traffic regulations) were pointed out. The second category of answers can be characterised as raising awareness and a sense of responsibility for one’s own behaviour and its consequences. It also highlights the need for mutual respect and consideration among individual road users. In particular, the role of the driver as a person responsible for driving a car (which is the originator of the energy that can injure or kill in a collision) was stressed.
CONCLUSION
Road users’ behaviour is absolutely crucial for the assurance of traffic safety. Safety measures at other levels of the traffic system (including the traffic infrastructure and vehicles) will only be effective as long as they are accepted by road users. Traffic safety culture is one of the factors that influence road users’ behaviour – whether they behave in a way that is expected and desirable (e.g. in compliance with the traffic rules) or unexpected, undesirable, and risk-posing.
A traffic safety culture is rather a multifaceted concept which defines the norms, attitudes, and opinions in relation to the issue of traffic safety at the societal level (not the individual level). In other words, it is something that is shared by the given society and influences the behaviour of its members. Traffic safety cultures vary from society to society (country to country). Evidence shows that while the traffic safety culture is not associated with the economic development of a country, it is associated with the current level of traffic safety in a given country. It also appears that there are variations in the way the traffic safety culture is perceived by members of the same society. Such differences concern the perception of the world, specifically the world as a reflection of a concrete reality (i.e. things are effects of specific actions, behaviour) and the world as a reflection of magic thinking (i.e. things are or are not the way they should be).
Differences in the perception of the traffic safety culture have key implications for practice. As previously mentioned, traffic safety measures can hardly be effective without being fully accepted by road users. The level of acceptance rises if a traffic safety measure is aligned with both the individual personal characteristics (e.g. better acceptance of the traffic regulations by people showing a high level of respect for authority) and the predominant traffic safety culture in a country.
As stated above, the traffic safety culture of a country is associated with the actual traffic safety situation in that country (expressed as the number of road fatalities). The poorer the traffic safety record, the more citizens believe that all available means should be used to improve it. A concrete implication for practice may be seen in that we can assume that a given society is prepared to accept significant changes and adjustments leading to the dramatic improvement of safety (such as zero tolerance for driving under the influence of alcohol, prison terms for significant violation of speed limits, and the marked strengthening of enforcement). Countries with a better traffic safety record can be assumed to have undergone the phase of profound changes in traffic safety in the past, and their better traffic safety situation is the result of such measures. The traffic safety culture in these countries is different: it can be referred to as more mature, reflecting compromise and various other effects produced by the measures aimed at improving traffic safety. This perspective must be borne in mind when looking at the implications of the traffic safety culture for practice in the countries: the measures proposed for implementation must be subjected to broad discussion and all aspects (and all stakeholders) must be taken into account. Stages of the development of traffic safety culture which reflect the current (actual) traffic safety situation can be identified in this respect. Concrete implementations of this research results’ vary in the respect of traffic safety level of each country. The poorer traffic safety record, the more strict and straight forward traffic safety measures should be implemented. On the other hand, in the countries with better traffic safety report, measures must be carefully considered according to all other implications (e.g. mobility, comfort, travel time).
The confirmation of the concept of a traffic safety culture as a multifaceted phenomenon encompassing both the specific behaviour (reality as the effect of specific acts) and the motivation behind such behaviour (reality as it should be), i.e. what motivates and drives our behaviour, suggests the importance of pursuing a comprehensive approach in order to exert an influence on road users. At the level of reality as the effect of specific acts, this can involve good and clear legal regulation and rigorous law enforcement or good and evidence-based education and training. At the level of reality as it should be, this can involve various campaigns or other forms of communication with (and among) road users with the purpose of raising their self-awareness and sense of responsibility.
The main limitation of this research is the relatively small sample size and its division according to the different continents and countries. Not all regions were covered sufficiently. The results may have been biased by the fact that the groups created for the purposes of data analysis were not fully consistent. The other limitation is that the data was collected anonymously using online questionnaires. Besides the country of their residence, no other data about the respondents is available. The respondents’ social status, age, gender, and level of expertise could significantly shape their answers.
We recommend that future research should eliminate these limitations by collecting data via national traffic safety organisations, which could guarantee – to some extent – the stratification of the sample. Furthermore, it is recommended that a greater attention is focused on country-specific issues of drivers’ risk perception, which – as shown in this article – seems to be crucial for further traffic safety improvements.
CONFLICT OF INTEREST
The authors confirm that this article content has no conflict of interest.
ACKNOWLEDGEMENTS
Palacky University Olomouc research funds, 2013-2016, No. 452100401: Traffic Psychology Dictionary: Czech-German-English.