All published articles of this journal are available on ScienceDirect.

Emotional and Behavioral Difficulties and Academic Motivation in Rural Adolescents: An Ecological-Psychosocial Model
 iD
Bonar Hutapea1
iD
Ernawati Ernawati2
iD
Bagus Mulyawan3
iD
Yohanes Firmansyah2
iD
iD
Bonar Hutapea1
iD
Ernawati Ernawati2
iD
Bagus Mulyawan3
iD
Yohanes Firmansyah2
iD
Authors Info & Affiliations
Abstract
Introduction
Adolescents in rural regions face unique psychosocial challenges shaped by familial dynamics and digital exposure. This study addresses a critical gap in the understanding of the psychosocial pathway linking screen time, emotional/behavioral difficulties, and academic motivation in underrepresented rural contexts.
Methods
A cross-sectional dyadic study (N=92 adolescent-caregiver dyads) was conducted in rural Salatiga, Indonesia. Data were collected using validated self-report measures assessing psychosocial functioning, screen time, and parenting. Regression-based path modeling with bootstrap estimation (5,000 resamples) was employed to examine direct and indirect associations, with an exploratory analytical orientation given the sample size.
Results
Emotional and behavioral difficulties emerged as the primary correlate of academic motivation, explaining 40.7% of its variance. Psychological distress showed a positive association, whereas well-being showed a negative association with difficulties. Screen time variables demonstrated weaker and less consistent relationships with outcomes. Indirect mediation effects were limited and should be interpreted exploratorily.
Discussion
These findings suggest that adolescent functioning is more closely linked to psychological adjustment than to screen-based behaviors. The results align with theoretical perspectives that emphasize the roles of both distress and well-being, while also indicating that the effects of screen use may depend on context rather than overall duration.
Conclusion
Strengthening social connectedness and caregiver mental health is vital for rural educational engagement. Screen exposure should be interpreted within broader psychological and relational contexts rather than as an isolated risk factor.
1. INTRODUCTION
Adolescence represents a critical developmental period marked by rapid biological, psychological, and social changes. During this stage, individuals become increasingly vulnerable to emotional and behavioral difficulties, which may have lasting consequences for well-being and functioning across the lifespan. Longitudinal evidence indicates that mental health problems in adolescence are associated with poorer mental health, reduced quality of life, and impaired functioning in adulthood [1, 2]. Global reports have further highlighted the growing burden of mental health problems among adolescents, emphasizing the need to understand better the factors that shape psychosocial development during this period [3, 4].
Psychosocial functioning in adolescence is commonly conceptualized as encompassing both difficulties and strengths. The Strengths and Difficulties Questionnaire (SDQ) provides a widely used framework for capturing this dual perspective, distinguishing between emotional and behavioral difficulties and prosocial behavior [5]. Difficulties such as emotional symptoms, conduct problems, and peer-related challenges are associated with a range of adverse outcomes, while prosocial behavior reflects adaptive functioning that supports social integration and developmental competence [6, 7]. Understanding how these dimensions relate to broader psychological and contextual factors remains an important area of inquiry.
One important perspective in this regard is the dual-factor model of mental health, which posits that psychological well-being and psychological distress are related but distinct constructs [8, 9]. Rather than representing opposite ends of a single continuum, well-being and distress capture different aspects of mental health and may contribute uniquely to adolescent functioning. This perspective suggests that examining both positive and negative indicators is essential for a more comprehensive understanding of psychosocial outcomes.
In addition to psychological functioning, academic motivation plays a central role in adolescent development. According to self-determination theory, motivation is shaped by the satisfaction of basic psychological needs and can range from intrinsic to extrinsic motivation [10, 11]. Higher levels of adaptive motivation are associated with greater engagement, persistence, and academic performance, whereas amotivation is linked to disengagement and poorer outcomes. These patterns suggest that motivation is closely intertwined with both individual and social functioning.
Contemporary discussions of adolescent development have also focused on the role of digital technology, particularly screen time. While concerns about excessive screen use are widespread, empirical findings remain varied. Recent large-scale studies and reviews suggest that the association between screen time and well-being is generally small and varies depending on the type and context of use [12, 13]. This highlights the need for more nuanced approaches that consider multiple domains of functioning rather than treating screen time as a uniform risk factor.
Family context represents a significant factor influencing adolescent development. Parenting styles, characterized by dimensions such as warmth, control, and responsiveness, have been consistently linked to emotional and behavioral outcomes [14, 15]. In addition, caregiver psychological distress may influence the family environment and, in turn, adolescent functioning. Therefore, considering both parenting practices and caregiver well-being may provide a more comprehensive understanding of adolescent development within the family context.
Despite an expanding body of research on these domains, existing studies have often examined psychological factors, behavioral patterns, and family influences in isolation. Relatively few studies have integrated these domains within a single analytical framework, particularly in non-Western or underrepresented contexts. Moreover, the potential interplay among these factors, including the role of indirect pathways, remains insufficiently explored. This gap limits the ability to develop a more integrated understanding of adolescent functioning across multiple levels of influence.
The significance of this research lies in its focus on the "Rural Digital Paradox," where limited physical resources meet high digital exposure. This study fills a critical gap by using a dyadic (student-caregiver) approach to illuminate how rural families navigate these dynamics, a context disproportionately underrepresented in urban-centric literature.
1.1. Theoretical Framework and Conceptual Model
This study was guided by an ecological-psychosocial framework that integrates three complementary theoretical perspectives. First, ecological systems theory (Bronfenbrenner) [16] emphasizes that adolescent development is shaped by multiple interrelated contexts, including individual characteristics, family processes, peer relationships, school experiences, and broader sociocultural conditions. From this perspective, screen time behaviors, parenting styles, caregiver distress, and social connectedness can be understood as ecological factors that may influence adolescent psychosocial and academic functioning.
Second, the dual-factor model of mental health (Keyes; Suldo & Shaffer) [8, 9] provides a framework for understanding adolescent adjustment through both negative and positive indicators of functioning. This model distinguishes psychological distress from well-being and suggests that the absence of symptoms does not necessarily indicate optimal mental health. In the present study, emotional and behavioral difficulties, youth distress, well-being, and prosocial behavior were therefore included to capture both risk and strength dimensions of adolescent psychosocial functioning.
Third, self-determination theory (Deci & Ryan) [10, 11] was used to frame academic motivation as an outcome shaped by adolescents' psychological functioning and social context. According to this theory, motivation is supported when adolescents experience competence, autonomy, and relatedness. Emotional and behavioral difficulties may undermine academic motivation by reducing students' capacity for self-regulation, perceived competence, and positive engagement in school-related activities. Conversely, prosocial behavior and social connectedness may support academic motivation by strengthening relatedness and adaptive social functioning.
Based on these perspectives, the present study conceptualized screen time behaviors as behavioral exposures, emotional and behavioral difficulties as a potential psychosocial mechanism, and academic motivation as the academic outcome. Additional ecological -psychosocial correlates, including parenting styles, caregiver distress, youth distress, well-being, social connectedness, and prosocial behavior, were included to provide a more integrated account of adolescent functioning. The proposed model assumes that screen time behaviors may be associated with academic motivation both directly and indirectly through emotional and behavioral difficulties, while family and psychosocial factors may help explain variations in adolescent adjustment and motivation. Figure 1 presents the conceptual framework guiding the analysis.
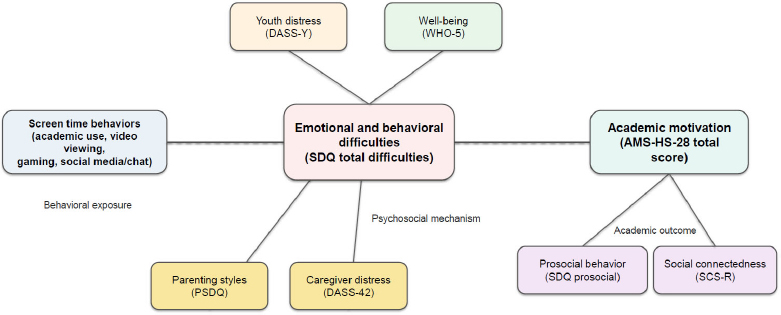
Conceptual ecological-psychosocial framework linking screen time behaviors, emotional and behavioral difficulties, and academic motivation in rural adolescents.
Note: Solid arrows indicate the primary indirect pathway examined in the exploratory model; the dashed arrow indicates the direct screen time-motivation pathway. Additional ecological-psychosocial correlates were included as predictors of emotional and behavioral difficulties and/or academic motivation.
1.2. The Present Study and Hypotheses
The present study addresses this gap by examining the associations between parenting styles, screen time behaviors, psychosocial functioning, and academic motivation among adolescents within a dyadic framework that incorporates both adolescent and caregiver variables. Given the complexity of these relationships and the characteristics of the available sample, the analysis was conducted with an exploratory orientation, aiming to identify patterns of association rather than test a fully specified causal model.
Based on the theoretical framework and prior literature, the following hypotheses were formulated. Given the cross-sectional design and modest sample size, these hypotheses were tested within an exploratory analytical framework.
H1: Higher levels of screen time, particularly recreational screen use, were expected to be associated with higher emotional and behavioral difficulties.
H2: Higher emotional and behavioral difficulties were expected to be associated with lower academic motivation.
H3: Emotional and behavioral difficulties were expected to mediate the association between screen time behaviors and academic motivation.
H4: Higher youth psychological distress and caregiver distress were expected to be associated with greater emotional and behavioral difficulties.
H5: Higher well-being and authoritative parenting were expected to be associated with lower emotional and behavioral difficulties, whereas higher prosocial behavior and social connectedness were expected to be associated with higher academic motivation.
2. METHODS
2.1. Study Design and Setting
This study employed a cross-sectional design to examine associations between parenting styles, screen time behaviors, psychosocial functioning, and academic motivation among adolescents. Data were collected at a public junior high school in Salatiga, Central Java, Indonesia, representing a rural educational context. The analytical approach was framed as exploratory given the sample size relative to model complexity.
2.2. Participants and Sampling
The study included 92 adolescent-caregiver dyads. Each adolescent was paired with one primary caregiver, defined as an adult responsible for daily care and supervision and who had lived with the adolescent for at least six months.
Participants were recruited from students in grades 7 to 9 using an alternating sampling approach. Adolescents completed questionnaires in a supervised classroom setting, while caregivers completed their questionnaires independently after obtaining informed consent.
Adolescents were eligible if they were enrolled at the selected school, aged 12 to 16 years, living with a primary caregiver, and able to complete the questionnaire independently. Exclusion criteria included severe cognitive or developmental conditions that could interfere with participation or absence during data collection. Caregivers were eligible if they met the definition of a primary caregiver and agreed to participate.
A dyadic design enabled the inclusion of caregiver-level variables alongside adolescent outcomes within a single analytic framework.
2.3. Sample Size Justification
Sample size adequacy was assessed according to the 10-times rule for PLS-SEM, which recommends a minimum sample size equal to 10-times the maximum number of predictor constructs directed toward an endogenous variable. The proposed model included 8 latent constructs (6 adolescent measures and 2 caregiver measures), resulting in a minimum sample size requirement of 80 participants (10 × 8 = 80). The study recruited 92 adolescent-caregiver dyads, thereby exceeding the recommended threshold. In addition, statistical inference was strengthened through a non-parametric bootstrapping procedure with 5,000 resamples, which was used to estimate standard errors, confidence intervals, and the significance of the structural path coefficients.
2.4. Research Procedures
Prior to data collection, permission was obtained from the school administration. Study objectives and procedures were explained to both adolescents and caregivers. Written informed consent was obtained from caregivers, and assent was obtained from adolescents.
Data were collected on-site. Adolescents completed questionnaires in a supervised classroom setting, while caregivers completed their questionnaires independently at the same location. No identifying information was collected, and responses were recorded anonymously. All data were handled confidentially in accordance with ethical standards for research involving human participants.
2.5. Measures
2.5.1. Student Measures
Social connectedness was assessed using the Social Connectedness Scale-Revised (SCS-R), a 20-item instrument rated on a 5-point Likert scale. Negatively worded items were reverse-coded prior to analysis, and higher scores indicate stronger perceived connectedness [17].
Emotional and behavioral functioning was measured using the Strengths and Difficulties Questionnaire (SDQ). The analysis focused on the total difficulties score, derived from emotional symptoms, conduct problems, hyperactivity, and peer problems, as well as the prosocial behavior subscale. The SDQ has demonstrated acceptable psychometric properties across adolescent populations, including Indonesian samples [7, 18].
Subjective well-being was assessed using the WHO-5 Well-Being Index, a brief measure of positive affective states. The instrument has been widely applied in adolescent research and supported by cross-cultural validation studies [19, 20].
Psychological distress was measured using the Depression, Anxiety, and Stress Scale for Youth (DASS-Y), which assesses symptoms across depression, anxiety, and stress domains. The scale has demonstrated sound validity and measurement invariance across adolescent populations [21, 22].
Academic motivation was assessed using the Academic Motivation Scale-High School Version (AMS-HS-28), which captures multiple dimensions of intrinsic and extrinsic motivation, as well as amotivation. The Indonesian version has demonstrated acceptable construct validity [23, 24].
Screen time behaviors were assessed using the Questionnaire for Screen Time of Adolescents (QueST), which measures the duration of engagement in academic activities, video viewing, gaming, and social media use [25].
2.5.2. Caregiver Measures
Parenting styles were assessed using the Parenting Styles and Dimensions Questionnaire (PSDQ), which measures authoritative, authoritarian, and permissive parenting dimensions [26]. Caregiver psychological distress was measured using the Depression, Anxiety, and Stress Scale-42 (DASS-42), which assesses symptoms across depression, anxiety, and stress domains [27].
2.6. Psychometric Evaluation and Instrument Transparency
To ensure the instrument's contextual validity, psychometric evaluations were performed specifically for the current rural sample. Internal consistency was evaluated using Cronbach's alpha based on the present sample, with reliability estimates interpreted using conventional thresholds (α ≥ 0.70). Item-total correlations were examined to assess item-level performance.
Detailed information on the questionnaire package is provided in Appendix Table A1, including respondent type, construct coverage, number of items, response format, scoring procedure, and representative items for each measure. Where full item reproduction was permitted, item lists are provided, including the SCS-R items presented in Appendix Table A2. For standardized instruments with copyright or use restrictions, representative items and scoring rules are reported to support transparency and reproducibility. Appendix Table A3 presents the item-to-construct mapping for all variables included in the structural model.
Reliability was evaluated empirically within the current dataset rather than assumed from prior studies. As shown in Appendix Table A4, several items, particularly within the social connectedness scale, showed weak or negative item-total correlations. Results involving this construct were therefore interpreted cautiously.
2.7. Data Analysis
All analyses were conducted using Python with the Pandas, SciPy, and StatsModels libraries. Descriptive statistics were computed for all variables. Due to non-normality in several measures, associations were examined using Spearman's rank correlation. Multicollinearity was assessed using variance inflation factors (VIF), with all values below conventional thresholds.
Regression-based path modeling was conducted using ordinary least squares estimation. Altogether, two models were specified: one predicting SDQ difficulties and one predicting academic motivation. Predictor selection was based on theoretical relevance and model parsimony.
Bootstrap resampling (5,000 iterations) was used to estimate coefficients and 95% confidence intervals. Indirect effects were examined using bootstrap-based mediation analysis. Effects were considered supported when confidence intervals did not include zero. Mediation results were interpreted cautiously given the exploratory design.
2.8. Data Handling and Statistical Thresholds
Analyses were conducted using complete-case data, with missing values handled through listwise deletion. Missing data were minimal and did not materially affect the sample, as summarized in Appendix Table A5. Statistical significance was defined as p < .05. Interpretation emphasized effect sizes and confidence intervals rather than reliance on p-values alone.
3. RESULTS
3.1. Sociodemographic Characteristics
The sample consisted of 92 adolescent-caregiver dyads. Adolescents were nearly evenly distributed by gender, and caregivers were predominantly female. Most caregivers were married. Detailed characteristics are reported in Table 1.
| Characteristic | Category | n (%) / Mean (SD) |
|---|---|---|
| Child gender | Male | 45 (48.9) |
| Female | 47 (51.1) | |
| Child age (years) | 13.43 (0.60) | |
| Caregiver gender | Male | 33 (35.9) |
| Female | 59 (64.1) | |
| Caregiver occupation | Farmer | 2 (2.2) |
| Housewife | 34 (37.0) | |
| Artisan/Craftsman | 23 (25.0) | |
| Other | 33 (35.9) | |
| Marital status | Married | 87 (94.6) |
| Divorced | 5 (5.4) | |
| Caregiver age (years) | 44.27 (8.50) |
3.2. Descriptive Statistics
Descriptive statistics for all study variables are presented in Table 2. Academic motivation, social connectedness, and SDQ difficulties showed moderate dispersion. Screen time varied across activity types, with academic-related use higher than other categories.
| Variable | n | Mean | SD | Min | P25 | Median | P75 | Max |
|---|---|---|---|---|---|---|---|---|
| Permissive parenting | 92 | 10.00 | 3.26 | 5.00 | 7.00 | 10.00 | 12.00 | 18.00 |
| Authoritarian parenting | 92 | 27.28 | 5.69 | 13.00 | 24.00 | 27.00 | 30.00 | 42.00 |
| Authoritative parenting | 92 | 63.10 | 7.16 | 41.00 | 58.00 | 64.00 | 68.00 | 75.00 |
| Screen time for academic study | 92 | 5.72 | 2.51 | 0.43 | 4.04 | 6.29 | 7.43 | 10.16 |
| Screen time for watching videos | 92 | 2.81 | 2.09 | 0.00 | 1.27 | 2.30 | 3.72 | 9.57 |
| Screen time for gaming | 92 | 2.58 | 2.89 | 0.00 | 0.92 | 1.57 | 3.26 | 22.29 |
| Screen time for social media | 92 | 3.53 | 3.07 | 0.14 | 1.62 | 2.71 | 4.46 | 20.57 |
| Caregiver distress | 92 | 6.16 | 4.79 | 0.00 | 1.67 | 6.00 | 9.67 | 16.00 |
| Youth distress | 92 | 10.98 | 2.99 | 7.00 | 9.00 | 10.33 | 12.33 | 21.67 |
| SDQ difficulties | 92 | 14.29 | 4.19 | 6.00 | 12.00 | 14.00 | 17.00 | 27.00 |
| Prosocial behavior (SDQ) | 92 | 7.22 | 1.64 | 3.00 | 6.00 | 7.00 | 8.25 | 10.00 |
| Social connectedness | 92 | 72.64 | 8.57 | 45.00 | 68.00 | 73.00 | 79.00 | 90.00 |
| Well-being | 92 | 17.15 | 6.02 | 3.00 | 13.00 | 18.00 | 22.00 | 25.00 |
| Academic motivation | 92 | 103.60 | 14.50 | 66.00 | 93.75 | 104.00 | 112.00 | 133.00 |
3.2.1. Internal Consistency of Measures
The internal consistency of the study constructs is summarized in Table 3. Most scales demonstrated acceptable to high reliability. The social connectedness scale showed lower internal consistency and is interpreted cautiously in subsequent analyses.
| Construct | Number of Items | Valid n | Cronbach’s Alpha |
|---|---|---|---|
| Social Connectedness Scale (SCS) | 20 | 92 | 0.481 |
| WHO-5 Well-Being Index | 5 | 92 | 0.836 |
| Academic Motivation Scale-High School (AMS-HS) | 28 | 92 | 0.902 |
| DASS-Y Youth Distress | 25 | 92 | 0.658 |
| Parenting Styles and Dimensions Questionnaire (PSDQ) | 32 | 92 | 0.750 |
| DASS-42 Caregiver Distress | 42 | 92 | 0.954 |
3.3. Correlation Analysis
Spearman correlation results are presented in Table 4. SDQ difficulties were strongly associated with youth distress and inversely related to well-being and social connectedness. Academic motivation was positively associated with prosocial behavior and social connectedness, and inversely related to SDQ difficulties.
| Variable | 1 | 2 | 3 | 4 | 5 | 6 | 7 | 8 | 9 | 10 | 11 | 12 | 13 | 14 |
|---|---|---|---|---|---|---|---|---|---|---|---|---|---|---|
| 1. Permissive parenting | 1.000 | |||||||||||||
| 2. Authoritarian parenting | 0.488 | 1.000 | ||||||||||||
| 3. Authoritative parenting | -0.062 | 0.167 | 1.000 | |||||||||||
| 4. Screen time for academic study | 0.217 | 0.014 | -0.060 | 1.000 | ||||||||||
| 5. Screen time for watching videos | 0.021 | 0.001 | 0.065 | 0.273 | 1.000 | |||||||||
| 6. Screen time for gaming | -0.032 | -0.057 | 0.094 | -0.110 | 0.069 | 1.000 | ||||||||
| 7. Screen time for social media | 0.116 | 0.057 | -0.029 | 0.358 | 0.492 | 0.148 | 1.000 | |||||||
| 8. Caregiver distress | 0.442 | 0.359 | -0.071 | 0.144 | 0.058 | -0.143 | 0.167 | 1.000 | ||||||
| 9. Youth distress | 0.002 | 0.021 | 0.153 | 0.012 | 0.101 | -0.243 | 0.091 | 0.179 | 1.000 | |||||
| 10. Prosocial behavior (SDQ) | -0.015 | -0.021 | 0.004 | 0.299 | 0.019 | -0.207 | 0.117 | -0.171 | 0.014 | 1.000 | ||||
| 11. SDQ difficulties | 0.050 | 0.152 | 0.272 | 0.019 | 0.150 | -0.143 | 0.146 | 0.217 | 0.683 | -0.058 | 1.000 | |||
| 12. Social connectedness | -0.033 | -0.092 | -0.153 | 0.131 | -0.232 | -0.147 | -0.003 | -0.104 | -0.235 | 0.422 | -0.380 | 1.000 | ||
| 13. Well-being | -0.064 | 0.036 | 0.016 | 0.067 | -0.326 | -0.049 | -0.097 | -0.209 | -0.412 | 0.203 | -0.460 | 0.488 | 1.000 | |
| 14. Academic motivation | -0.046 | 0.006 | -0.123 | 0.307 | -0.024 | -0.161 | 0.102 | 0.061 | -0.071 | 0.562 | -0.240 | 0.506 | 0.286 | 1.000 |
Screen time variables showed smaller and less consistent associations compared to psychosocial variables.
3.4. Direct Effects
All variance inflation factors were below conventional thresholds, indicating no evidence of problematic multicollinearity. Bootstrapped regression results are presented in Table 5.
| Outcome | Predictor | B | SE | t | p | 95% Bootstrap CI |
|---|---|---|---|---|---|---|
| SDQ difficulties | Permissive parenting | -0.070 | 0.116 | -0.608 | 0.545 | (-0.271, 0.148) |
| SDQ difficulties | Authoritarian parenting | 0.099 | 0.065 | 1.530 | 0.130 | (0.005, 0.191) |
| SDQ difficulties | Authoritative parenting | 0.132 | 0.044 | 2.987 | 0.004 | (0.044, 0.228) |
| SDQ difficulties | Screen time for academic study | 0.073 | 0.136 | 0.534 | 0.595 | (-0.173, 0.323) |
| SDQ difficulties | Screen time for watching videos | -0.115 | 0.174 | -0.663 | 0.509 | (-0.489, 0.201) |
| SDQ difficulties | Screen time for gaming | -0.184 | 0.112 | -1.642 | 0.105 | (-0.429, 0.021) |
| SDQ difficulties | Screen time for social media | 0.175 | 0.117 | 1.496 | 0.139 | (-0.008, 0.419) |
| SDQ difficulties | Caregiver distress | 0.023 | 0.075 | 0.312 | 0.756 | (-0.131, 0.168) |
| SDQ difficulties | Youth distress | 0.664 | 0.119 | 5.556 | <0.001 | (0.399, 0.970) |
| SDQ difficulties | Social connectedness | -0.054 | 0.041 | -1.321 | 0.190 | (-0.146, 0.038) |
| SDQ difficulties | Well-being | -0.164 | 0.065 | -2.539 | 0.013 | (-0.288, -0.038) |
| Academic motivation | SDQ difficulties | -0.832 | 0.413 | -2.011 | 0.048 | (-1.629, -0.032) |
| Academic motivation | Prosocial behavior (SDQ) | 3.536 | 0.833 | 4.248 | <0.001 | (1.828, 5.314) |
| Academic motivation | Social connectedness | 0.374 | 0.177 | 2.110 | 0.038 | (-0.019, 0.799) |
| Academic motivation | Well-being | 0.133 | 0.257 | 0.519 | 0.605 | (-0.422, 0.704) |
| Academic motivation | Youth distress | 0.497 | 0.554 | 0.896 | 0.373 | (-0.480, 1.588) |
| Academic motivation | Screen time for academic study | 0.622 | 0.549 | 1.134 | 0.260 | (-0.382, 1.644) |
| Academic motivation | Screen time for watching videos | 0.011 | 0.693 | 0.017 | 0.987 | (-1.687, 1.542) |
| Academic motivation | Screen time for gaming | -0.531 | 0.451 | -1.175 | 0.243 | (-1.258, 1.550) |
| Academic motivation | Screen time for social media | 0.235 | 0.462 | 0.509 | 0.612 | (-0.764, 1.082) |
3.4.1. SDQ Difficulties
Youth distress was positively associated with SDQ difficulties, whereas well-being was negatively associated. Authoritative parenting showed a small positive association. Other predictors were not statistically significant.
3.4.2. Academic Motivation
SDQ difficulties were negatively associated with academic motivation. Prosocial behavior and social connectedness showed positive associations, though the latter should be interpreted with caution given the confidence interval. No significant associations were observed for screen time variables or youth distress in the adjusted model.
3.5. Indirect Effects
Bootstrapped indirect effects are presented in Table 6. Most indirect effects through SDQ difficulties were not statistically supported. A positive indirect effect was observed for gaming via SDQ difficulties, although the direction and magnitude warrant cautious interpretation.
| Predictor (X) | Mediator | Outcome (Y) | Indirect Effect | 95% Bootstrap CI | Direct Effect | 95% Bootstrap CI |
|---|---|---|---|---|---|---|
| Permissive parenting | SDQ difficulties | Academic motivation | -0.042 | (-0.359, 0.237) | -0.138 | (-0.916, 0.613) |
| Authoritarian parenting | SDQ difficulties | Academic motivation | -0.103 | (-0.257, 0.024) | 0.116 | (-0.403, 0.643) |
| Screen time for watching videos | SDQ difficulties | Academic motivation | -0.276 | (-0.797, 0.093) | -0.040 | (-1.882, 1.592) |
| Screen time for gaming | SDQ difficulties | Academic motivation | 0.399 | (0.013, 0.828) | -0.953 | (-2.067, 0.332) |
| Screen time for social media | SDQ difficulties | Academic motivation | -0.253 | (-0.760, 0.035) | 0.681 | (-0.284, 1.712) |
| Social connectedness | SDQ difficulties | Academic motivation | 0.058 | (-0.084, 0.218) | 0.764 | (0.347, 1.151) |
Overall, mediation patterns were limited and exploratory.
4. DISCUSSION
4.1. Overview of Findings
The present study examined associations between parenting styles, screen time behaviors, psychosocial functioning, and academic motivation within an exploratory framework. Overall, the findings indicate that emotional and behavioral difficulties were more strongly associated with psychological factors, particularly distress and well-being, than with behavioral variables such as screen time. Academic motivation was negatively associated with emotional and behavioral difficulties and positively associated with prosocial behavior, while screen-based activities showed relatively weak and inconsistent relationships with the outcomes. Mediation effects were limited and did not provide consistent support for indirect pathways.
4.2. Interpretation of Key Associations
The strong association between psychological distress and emotional and behavioral difficulties is consistent with the broader literature on adolescent mental health, which conceptualizes distress as a central correlate of internalizing and externalizing problems during a period of heightened developmental sensitivity [28]. At the same time, the inverse association between well-being and difficulties aligns with the dual-factor model of mental health, which emphasizes that positive functioning and psychopathology represent related but distinct dimensions [8, 9]. The present findings support this perspective, suggesting that both distress and well-being contribute uniquely to adolescents' psychosocial functioning.
Academic motivation showed a pattern consistent with motivational theories, particularly self-determination theory. The negative association between emotional and behavioral difficulties and motivation suggests that dysregulation and behavioral problems may interfere with students' engagement, perceived competence, and persistence in school-related activities [10, 11]. In contrast, the positive association between prosocial behavior and motivation may reflect the role of social competence and relatedness in supporting academic engagement [10, 11]. Although Anvari's recent review focuses primarily on motivation in performance-related organizational contexts, its emphasis on motivation as a driver of effort, persistence, and goal-directed behavior is consistent with the present interpretation of academic motivation as a performance-relevant educational construct [29]. These findings indicate that motivation is not only an individual cognitive construct but is also linked to broader psychosocial functioning.
In contrast, screen time variables showed relatively weak and inconsistent associations with emotional and behavioral difficulties and academic motivation. This finding does not necessarily indicate that screen use is unrelated to adolescent functioning. Rather, it suggests that broad screen-time indicators may not fully capture the conditions under which digital media use becomes beneficial, neutral, or harmful. Prior research has indicated that the effects of screen-time may depend on content, purpose, timing, social context, and whether screen use displaces sleep, physical activity, face-to-face interaction, or academic engagement [12, 13]. Since the present study measured screen time by general activity domains without assessing more specific features such as nighttime use, passive versus active engagement, emotional tone of content, parental mediation, or problematic use patterns, the findings should be interpreted cautiously.
4.3. Limited Mediation Effects and Model Complexity
Contrary to expectations, the mediation analyses did not provide consistent support for indirect pathways linking screen time or parenting variables to outcomes through emotional and behavioral difficulties. Most indirect effects were small and not statistically supported, and thus should be interpreted with appropriate caution.
Several factors may explain these findings. First, the relatively modest sample size limits statistical power for detecting indirect effects, which are typically smaller and more sensitive to sampling variability [30, 31]. Second, the complexity of the initial conceptual model relative to the available data may have reduced the stability of parameter estimates. Third, measurement limitations, particularly variability in item performance within some scales, may have attenuated the detection of indirect effects.
The findings do not support strong mediation mechanisms in the present dataset. Instead, they suggest that the observed relationships are better interpreted as direct associations within an exploratory framework rather than as evidence of well-defined causal pathways.
4.4. Measurement Considerations
The psychometric evaluation indicated that most instruments demonstrated acceptable internal consistency within the present sample. However, the social connectedness scale showed relatively low reliability, accompanied by substantial variability in item-total correlations, including several weak or negative values.
This pattern may reflect challenges in construct alignment within the current context, including potential issues related to cultural adaptation, item interpretation, or multidimensionality. Previous research has emphasized that the psychometric performance of established instruments may vary across populations and settings, particularly when applied in different cultural contexts [32, 33]. As a result, findings involving social connectedness should be interpreted cautiously, and future studies should consider further validation or refinement of this measure.
4.5. Theoretical Implications
The findings offer several theoretical implications. First, they provide partial support for an ecological-psychosocial understanding of adolescent academic motivation by showing that motivational functioning is more closely linked to emotional and behavioral adjustment than to screen time alone. This suggests that screen exposure should not be treated as an isolated behavioral risk factor but should be interpreted within broader psychological and relational contexts.
Second, the findings support the dual-factor model of mental health by showing that psychological distress and well-being were both associated with emotional and behavioral difficulties. This pattern indicates that adolescent adjustment cannot be fully understood by measuring symptoms alone. Positive well-being may provide additional explanatory value in understanding why some adolescents show fewer difficulties despite exposure to contextual or behavioral risks.
Third, the findings refine the proposed mediation model. Although emotional and behavioral difficulties were associated with academic motivation, they did not consistently mediate the relationship between screen time and motivation. This suggests that the screen time-motivation link may be more indirect, context-dependent, or contingent on unmeasured factors such as sleep quality, digital content, parental mediation, self-regulation, and perceived academic competence.
4.6. Practical Implications
The findings have practical implications for school-based mental health and academic support. First, schools should not rely solely on screen time reduction as a strategy to improve academic motivation. Although excessive screen use may be relevant, the present findings suggest that emotional distress, well-being, prosocial behavior, and behavioral adjustment may be more immediate targets for intervention.
Second, school-based screening should include both negative and positive indicators of mental health. Assessing distress alone may overlook students with low well-being, poor social connectedness, or reduced motivation. A brief screening model combining emotional difficulties, well-being, and academic motivation may assist teachers and school counselors in identifying students who require early support.
Third, interventions to strengthen academic motivation should incorporate psychosocial components. Programs that promote emotion regulation, peer support, prosocial behavior, and supportive teacher-student relationships may be more effective than interventions focused only on study habits or digital restriction. For rural adolescents, school-based approaches may be particularly important, as access to specialized psychological services can be limited.
Fourth, parents and caregivers should be involved in prevention efforts. Rather than framing screen use only as a disciplinary issue, caregivers can be guided to support balanced digital habits, monitor emotional changes, encourage sleep routines, and maintain warm communication with adolescents.
4.7. Limitations and Future Directions
Several limitations should be noted. The cross-sectional design does not allow conclusions about directionality, and the observed associations should be interpreted accordingly. Estimates of indirect effects derived from cross-sectional data may also be biased when interpreted as longitudinal processes [34]. Longitudinal designs would be needed to examine how these relationships unfold over time.
The sample size was below the recommended threshold for the model's complexity, potentially reducing statistical power, particularly for detecting indirect effects. Estimates from the present analyses should therefore be interpreted with caution.
Measurement issues also need to be considered. In particular, the relatively low reliability of the social connectedness scale in this sample may have attenuated some associations. Further evaluation of this measure in similar populations is needed.
The study was conducted in a single school context, which may limit the generalizability of the findings. Replication in more diverse educational and cultural settings would help clarify the extent to which these patterns hold across contexts.
Future work would benefit from longitudinal designs, improved measurement strategies, and more parsimonious models to better capture the relationships among parenting, screen use, psychosocial functioning, and academic outcomes.
CONCLUSION
This study examined how parenting, screen use, and psychological functioning relate to adolescent outcomes within an exploratory framework. The results point to a clearer role for psychological factors than for screen-based behaviors. Distress and well-being were consistently linked to emotional and behavioral difficulties, while academic motivation was associated with both difficulties and prosocial functioning. Evidence for indirect pathways was limited.
These findings suggest that focusing solely on screen time may overlook more proximal influences on adolescent functioning. Instead, psychological adjustment, both negative and positive, appears to be more closely tied to how adolescents function socially and academically. The results also indicate the relevance of considering both individual and family contexts when examining these outcomes.
Several limitations should be noted. The cross-sectional design does not allow conclusions about directionality, and the sample size limits the stability of more complex estimates. Future work would benefit from longitudinal designs, larger samples, and improved measurement approaches to better clarify these relationships.
AUTHORS’ CONTRIBUTIONS
The authors confirm their contribution to the paper as follows: F.I.R.D.: Study conception and design; B.H.: Validation:; E.E., Y.F.: Investigation; B.M.: Visualization. All authors reviewed the results and approved the final version of the manuscript.
LIST OF ABBREVIATIONS
| AMS-HS-28 | = Academic Motivation Scale-High School Version |
| DASS | = Depression Anxiety Stress Scales |
| PLS-SEM | = Partial Least Squares Structural Equation Modeling |
| PSDQ | = Parenting Styles and Dimensions Questionnaire |
| SDQ | = Strengths and Difficulties Questionnaire |
| WHO-5 | = World Health Organization Five Well-Being Index |
ETHICS APPROVAL AND CONSENT TO PARTICIPATE
This study was approved by the Institutional Review Board of the Universitas Tarumanagara Human Research Ethics Committee, Institute of Research and Community Engagement, Indonesia, under approval No. 014-UTHREC/UNTAR/VII/2025.
HUMAN AND ANIMAL RIGHTS
All procedures performed in studies involving human participants were in accordance with the ethical standards of institutional and/or research committees and with the 1975 Declaration of Helsinki, as revised in 2013.
CONSENT FOR PUBLICATION
Written informed consent to participate was obtained from all adult participants. For participants who were minors, written informed consent was obtained from their parents or legal guardians, with assent obtained from the minors where applicable.
AVAILABILITY OF DATA AND MATERIALS
The data analyzed in this study were obtained through original data collection conducted by the authors. The dataset has not been previously published and does not contain copyrighted material or data owned by third parties. The datasets generated and/or analyzed during the current study are not publicly available due to participant confidentiality. The data are securely stored in the restricted institutional research repository of Universitas Tarumanagara and may be made available upon reasonable request by the corresponding author [F.D].
FUNDING
This research was funded by the Directorate of Research, Technology, and Community Service, the Directorate General of Higher Education, Research, and Technology, the Ministry of Education, Culture, Research, and Technology, Republic of Indonesia, under Research Contract Number 1011/LL3/AL.04/2025.
ACKNOWLEDGEMENTS
The authors thank the school administration, teachers, adolescents, and caregivers in Salatiga, Indonesia, for their participation and support in this study. The authors also sincerely acknowledge the Directorate of Research, Technology, and Community Service; the Directorate General of Higher Education, Research, and Technology; and the Ministry of Education, Culture, Research, and Technology of Indonesia for their funding.
SUPPLEMENTARY MATERIAL
The supplementary material is available on the publisher’s website along with the published article.
APPENDIX
| Respondent | Construct | Instrument | Source | No. of Items | Response Format | Scoring Used in Analysis | Representative Item |
|---|---|---|---|---|---|---|---|
| Adolescent | Screen time behaviors | Questionnaire for Screen Time of Adolescents (QueST) | Knebel et al. (2020) [25] | 5 domains | Hours and minutes for school days and holidays | Separate domain scores for academic use, video viewing, gaming, and social media/chat use | “Pada hari biasa, berapa banyak waktu yang Anda habiskan… bermain gim video di konsol gim, komputer, televisi, tablet, smartphone, atau perangkat elektronik lainnya?” / “On a typical day, how much time do you spend playing video games on a console, computer, television, tablet, smartphone, or other electronic device?” |
| Adolescent | Social connectedness | Social Connectedness Scale-Revised (SCS-R) | Bagaskara & Widyastuti (2023) [17] | 20 | 5-point agreement scale | Total score after reverse coding where applicable | “Saya merasa nyaman dengan kehadiran orang asing.” / “I feel comfortable in the presence of strangers.” |
| Adolescent | Well-being | WHO-5 Well-Being Index | Domenech et al. (2025) [19] | 5 | 6-point frequency scale over the past two weeks | Total well-being score | “Saya merasa ceria dan bersemangat.” / “I have felt cheerful and in good spirits.” |
| Adolescent | Emotional and behavioral difficulties | Strengths and Difficulties Questionnaire (SDQ) | Essau et al. (2012) [7]; Luzanil & Turnip (2021) [18] | 25 | 3-point response scale | Total difficulties score and prosocial behavior score | “Saya gelisah, saya tidak dapat diam untuk waktu lama.” / “I get restless; I cannot stay still for long.” |
| Adolescent | Academic motivation | Academic Motivation Scale-High School Version (AMS-HS-28) | Marvianto & Widhiarso (2019) [23]; Syah (2019) [24] | 28 | 5-point suitability scale | Total academic motivation score | “Karena saya merasa senang dan puas saat belajar hal-hal baru.” / “Because I feel happy and satisfied when learning new things.” |
| Adolescent | Youth distress | Depression, Anxiety, and Stress Scale for Youth (DASS-Y) | Jovanović (2025) [21]; Śliwerski et al. (2025) [22] | 21 | 4-point response scale | Composite distress score | “Saya marah atau kesal karena hal-hal kecil.” / “I get upset about little things.” |
| Caregiver | Parenting styles | Parenting Styles and Dimensions Questionnaire-Short Version (PSDQ) | Risnawaty et al. (2021) [26] | 32 | 5-point frequency scale | Composite scores for authoritative, authoritarian, and permissive parenting | “Saya mendorong anak untuk berbicara mengenai perasaan dan masalah-masalahnya.” / “I encourage my child to talk about their feelings and problems.” |
| Caregiver | Caregiver distress | Depression, Anxiety, and Stress Scale-42 (DASS-42) | Muttaqin & Ripa (2021) [27] | 42 | 4-point frequency scale, scored 0-3 | Composite distress score | “Menjadi marah karena hal-hal kecil/sepele.” / “I find myself getting upset by quite trivial things.” |
| Construct | Item Code | Item Text |
|---|---|---|
| Social Connectedness Scale-Revised | C1 | Saya merasa nyaman dengan kehadiran orang asing (I feel comfortable in the presence of strangers) |
| Social Connectedness Scale-Revised | C2 | Saya merasa selaras (sejalan/ bisa mengikuti perkembangan) dunia ini (I am in tune with the world) |
| Social Connectedness Scale-Revised | C3 | Bahkan di antara teman-teman saya, saya merasa tidak ada rasa persaudaraan (Even among my friends, there is no sense of brother/sisterhood) |
| Social Connectedness Scale-Revised | C4 | Saya mudah menyesuaikan diri dengan situasi baru (I fit in well in new situations) |
| Social Connectedness Scale-Revised | C5 | Saya merasa dekat dengan orang-orang (I feel close to people) |
| Social Connectedness Scale-Revised | C6 | Saya merasa terputus dari dunia di sekitar saya (I feel disconnected from the world around me) |
| Social Connectedness Scale-Revised | C7 | Meski berada di sekitar orang yang saya kenal, saya tidak merasa menjadi bagian dari mereka (Even around people I know, I don’t feel that I really belong) |
| Social Connectedness Scale-Revised | C8 | Saya melihat orang-orang secara umum sebagai orang yang ramah dan mudah didekati (I see people as friendly and approachable) |
| Social Connectedness Scale-Revised | C9 | Saya merasa seperti orang luar (I feel like an outsider) |
| Social Connectedness Scale-Revised | C10 | Saya merasa dimengerti oleh orang orang yang saya kenal (I feel understood by the people I know) |
| Social Connectedness Scale-Revised | C11 | Saya merasa jauh dari orang-orang (I feel distant from people) |
| Social Connectedness Scale-Revised | C12 | Saya dapat merasa berinteraksi (terhubung) dengan teman-teman sebaya saya (I am able to relate to my peers) |
| Social Connectedness Scale-Revised | C13 | Saya hanya memiliki sedikit rasa kebersamaan dengan teman-teman sebaya saya (I have little sense of togetherness with my peers) |
| Social Connectedness Scale-Revised | C14 | Saya merasa sebagai orang yang banyak terlibat dalam kehidupan orang-orang (I find myself actively involved in people’s lives) |
| Social Connectedness Scale-Revised | C15 | Saya merasa kehilangan rasa (tidak ada maknanya) saat berinteraksi dengan masyarakat (I catch myself losing a sense of connectedness with society) |
| Social Connectedness Scale-Revised | C16 | Saya mampu (dapat) terhubung dengan orang lain (I am able to connect with other people) |
| Social Connectedness Scale-Revised | C17 | Saya melihat diri saya sebagai seorang penyendiri (I see myself as a loner) |
| Social Connectedness Scale-Revised | C18 | Saya merasa tidak terhubung dengan kebanyakan orang (I feel I don’t relate to most people) |
| Social Connectedness Scale-Revised | C19 | Teman-teman saya terasa seperti keluarga (My friends feel like family) |
| Social Connectedness Scale-Revised | C20 | Saya tidak tergabung dengan siapa pun atau kelompok mana pun (I don’t participate with anyone or any group) |
| Construct | Instrument | Item Codes/subscales Used | Derived Score Used in Analysis |
|---|---|---|---|
| Academic screen time | Questionnaire for Screen Time of Adolescents (QueST) | QueST 1 | Academic-related screen time |
| Video viewing | Questionnaire for Screen Time of Adolescents (QueST) | QueST 3 | Video viewing duration |
| Gaming | Questionnaire for Screen Time of Adolescents (QueST) | QueST 4 | Gaming duration |
| Social media/chat use | Questionnaire for Screen Time of Adolescents (QueST) | QueST 5 | Social media/chat duration |
| Social connectedness | Social Connectedness Scale-Revised (SCS-R) | C1-C20 | Total social connectedness score |
| Well-being | WHO-5 Well-Being Index | WHO1-WHO5 | Total well-being score |
| SDQ total difficulties | Strengths and Difficulties Questionnaire (SDQ) | Emotional symptoms, conduct problems, hyperactivity, and peer problems subscales | Total difficulties score |
| Prosocial behavior | Strengths and Difficulties Questionnaire (SDQ) | Prosocial behavior subscale | Prosocial behavior score |
| Academic motivation | Academic Motivation Scale-High School Version (AMS-HS-28) | AMS1-AMS28 | Total academic motivation score |
| Youth distress | Depression, Anxiety, and Stress Scale for Youth (DASS-Y) | DASS-Y1-DASS-Y21 | Composite youth distress score |
| Authoritative parenting | Parenting Styles and Dimensions Questionnaire-Short Version (PSDQ) | Authoritative parenting subscale | Authoritative parenting score |
| Authoritarian parenting | Parenting Styles and Dimensions Questionnaire-Short Version (PSDQ) | Authoritarian parenting subscale | Authoritarian parenting score |
| Permissive parenting | Parenting Styles and Dimensions Questionnaire-Short Version (PSDQ) | Permissive parenting subscale | Permissive parenting score |
| Caregiver distress | Depression, Anxiety, and Stress Scale-42 (DASS-42) | DASS1-DASS42 | Composite caregiver distress score |
| Construct | Item | Item-total Correlation (ρ) | p-value |
|---|---|---|---|
| Social connectedness scale-revised | C1 | 0.010 | 0.926 |
| Social connectedness scale-revised | C2 | 0.143 | 0.174 |
| Social connectedness scale-revised | C3 | 0.214 | 0.041 |
| Social connectedness scale-revised | C4 | 0.015 | 0.884 |
| Social connectedness scale-revised | C5 | -0.098 | 0.355 |
| Social connectedness scale-revised | C6 | 0.449 | <0.001 |
| Social connectedness scale-revised | C7 | 0.298 | 0.004 |
| Social connectedness scale-revised | C8 | 0.085 | 0.422 |
| Social connectedness scale-revised | C9 | 0.389 | <0.001 |
| Social connectedness scale-revised | C10 | -0.115 | 0.273 |
| Social connectedness scale-revised | C11 | 0.367 | <0.001 |
| Social connectedness scale-revised | C12 | 0.018 | 0.868 |
| Social connectedness scale-revised | C13 | 0.401 | <0.001 |
| Social connectedness scale-revised | C14 | 0.047 | 0.658 |
| Social connectedness scale-revised | C15 | 0.402 | <0.001 |
| Social connectedness scale-revised | C16 | -0.109 | 0.301 |
| Social connectedness scale-revised | C17 | 0.274 | 0.008 |
| Social connectedness scale-revised | C18 | 0.357 | <0.001 |
| Social connectedness scale-revised | C19 | -0.230 | 0.028 |
| Social connectedness scale-revised | C20 | -0.010 | 0.928 |
| Variable Type | Number of Variables | Missing Data (n) | Percent Missing (%) |
|---|---|---|---|
| All study variables | 322 | 0 | 0.0 |