All published articles of this journal are available on ScienceDirect.

Rasch Analysis of the Indonesian Mental Health Screening Tools
Authors Info & Affiliations
Abstract
Introduction:
Along with massive developments in various aspects of life, mental health is one of the issues that must be discussed to encourage optimal development of an individual. To achieve these goals, we need an instrument that can measure and determine the mental health needs of humans precisely.
Materials and Methods:
The study was conducted using a cross-sectional method with a quantitative research design. Participants in this study were adolescent students from Indonesia and Malaysia. The American Mental Health Screening Tool adapted to Indonesian and Malaysian conditions is used as an instrument to measure mental health. There were 359 people from Indonesia and 171 people from Malaysia participating in this study. This type of parameter needs to be identified by the category coefficient of the RASCH scoring function model for polycotomic responses.
Results and Discussion:
The results showed that the American Screening Tools Mental Health instrument had a unidimensionality value below 15%, which means that the variables on the instrument were able to describe mental health. A total of 4 items were invalid so only 59 items could be used to measure mental health. Cronbach alpha value, which is 0.71 indicates that the instrument has good reliability. The average ability of participants from Indonesia and Malaysia was in the moderate category, but 39 participants from Malaysia and 18 participants from Indonesia gave answers that did not match their ability
Conclusion:
The screening tool instrument is able to describe the variables about mental health. These instruments tend to only describe the mental health of participants who fall into the medium and high categories.
1. INTRODUCTION
Mental health needs attention and is essential to identify. Individuals often experience various mental states, which lead them to destructive behavior [1-3]. We know that maintaining mental health is more than just treating or preventing mental illnesses [4, 5]. Maintaining mental health is essential to obtain satisfaction and well-being in life [6]
Most individuals have little willingness to share problems concerning their mental state. Even though the mental issue is
not yet significant, individuals often do not realize that it will be a big problem if there is no intervention to help them get out of the problem [7, 8]. Often individuals will choose to take extreme actions when their mental health conditions are very severe such as suicide, self-harming, and even harming others by hurting [9-11].
A study conducted by Prince et al. in 2007 showed that an individual's physical health also depends on his mental health. One study found that impaired mental health due to depression will lead to negative behaviors, such as consuming excessive alcohol, using illegal drugs, and even experiencing psychosis [12].
In another discussion in 2013, the World Health Organization (WHO) claimed that mental health is related to physical fitness and individual welfare. According to WHO, mental health includes attributes that exist in individuals such as thoughts, emotions, behavior, and interactions with others and includes other social, cultural, economic, political, and environmental factors. The pressures given to individuals, especially adolescents, will broadly cause a teenager to experience disorders in his mental health [13].
The phenomenon of mental health in education was also mentioned by the American College Health Association in 2008. More than one in three students claimed that they were depressed enough to make it difficult for them to do other activities. Besides, one in ten students reported that they had seriously considered trying to commit suicide due to stresses that made them severely depressed [14].
The findings above are the impacts that will occur if there is no action to prevent situations that can cause mental health problems for individuals. Therefore, it is necessary to take preventive action to avoid these impacts [15], such as identifying students' mental health. It should be an urgent step to design the follow-up to prevent disorders that can cause mental health problems for individuals [16].
It is noted that identifying mental health requires precision and caution because the identification results will be used as a reference for further follow-up [17]. In other words, the identification process of mental health in individuals must use valid instruments or describe mental health conditions that are appropriate to the individual's current situation.
Instruments that are said to be valid or capable of describing mental health conditions are instruments that have been analyzed and declared valid [18]. Analysis using the RASCH Model is one way that can investigate the instrument so that it can be said to be valid [19]. The RASCH model provides a detailed description of the scale structure of the instrument. Information that needs to be known to determine the instrument's quality is presented in the RASCH Model, such as unidimensionality, wright map analysis, item analysis, participant ability analysis, and instrument analysis [20].
Therefore, this study conducted a test of an instrument that measures mental health in adolescents. The instrument to be analyzed was the American Mental Health Screening Tools Instrument. The RASCH Model will be a way to analyze the instrument. The information that will convey after analysis using the RASCH Model is about unidimensionality, wright map analysis, item analysis, participant ability analysis, and instrument analysis [21]. This information will provide an overview of the instrument's scale structure so that the Mental Health American Screening Tools classified as an instrument is valid or invalid.
2. METHODS
The study was conducted using a quantitative approach with a cross-sectional research design. The subjects in this study were students who came from two countries, Indonesia and Malaysia. This study used simple random sampling in which every population member has an equal opportunity to be a participant [22].
In this research, the Rasch Model is used to analyze the results of the instrument. The Rasch Model has the advantage of producing a measurement scale with the same interval to provide accurate information about the participants and the quality of the work done. This research does not use the classical model because the classical model's items are inconsistent or change depending on participants' abilities. Thus, researchers use the Rasch Model to analyze instruments because it can provide solutions to overcome the classical model's shortcomings or limitations.
2.1. Population and Research Samples
Participants in this study are described in Table 1 as shown below:
| Country | N |
|---|---|
| Indonesia | 359 |
| Malaysia | 171 |
| Total | 530 |
3. RESULTS
3.1. Unidimensionality
Unidimensionality can be proven if Raw variance explained by measures ≥ 20% (Note: the general criteria for interpretation are: enough if 20-40%, good if 40-60%, and excellent if above 60%) and if Unexplained variance in 1st to fifth contrast of residuals <15% each. The following is a table of unidimensionality analysis:
The data analysis results showed that the raw variance explained by measures of 36.2% categorized as sufficient. Meanwhile, the unexplained variance in 1st to 5th contrast of residuals was 9.0%, 3.5%, 2.8%, 2.0%, and 2.0%, respectively. It appears that the Unexplained variance in the first contrast to the Unexplained variance in the fifth contrast can measure mental health in adolescents (Table 2).
3.2. Wright Map Analysis
The Output Table, namely the Table Variable Map, shows that the mental health instrument map spreads in the range of -6 to 4 logits. Their ability position is mostly between + 1SD and + 2SD. In the measure order table, the logit average of the mental health profile is +1.32, which is above the average logit item, which is 0.00. The average mental health profile is above the average difficulty level of the item standard.
3.3. Item Analysis
Item analysis consisted of item difficulty level analysis, item suitability analysis, diagnostic rating scale, and item bias analysis. Item Measure table was used to see the difficulty level of the items. The Item Fit Order table was also used to determine the level of suitability item. The rating table (partial credit) scale was used to determine the different answer choices. Item table: DIF, between/within, was used to find bias in items.
The item measure table was used to view the item difficulty level of the item. The analysis was carried out by combining the standard deviation with the logit mean value so that the level of difficulty of the items was grouped into several categories. The value limit for the severe category was more than 0.68, the difficult category was 0.00 to 0.68, the easy category was -0.68 to less than 0.00, and the specific category was less than -0.68.
In order based on the level of difficulty (from the most difficult to the easiest items), it is known that there are 14 items which are categorized as very difficult, namely items number 33, 30, 19, 32, 41, 37, 23, 48, 5, 18, 13, 12, 50, and 26. There are 17 difficult categories of items, namely numbers 46, 25, 42, 59, 54, 31, 8, 6, 49, 63, 56, 20, 22, 53, 10, 45, and 3. In the easy category, there are 19 items, namely 11, 40, 28, 15, 27, 35, 17, 24, 14, 62, 43, 1, 44, 58, 51, 60, 39, 34, and 21. In contrast, in the ‘very easy’ category there are 9 items, namely the numbers 9, 57, 16, 38, 36, 29, 47, 4, and 2.
According to Boone et al. (2014), to see the level of suitability of items, it is necessary to pay attention to the value of outfit means-square, outfit z-standard, and point measure correlation with the following provisions: (1) MNSQ OUTFIT value is more significant than 0.5 and less than 1, 5 and the closer to 1 the better; (2) ZSTD OUTFIT value greater than -2.0 and smaller than +2.0, and the closer to 0, the better; and (3) the value of PT MEASURE CORR is more than 0.4 and less than 0.85. An item can be considered fitting if it meets at least 1 of the three criteria.
These provisions found that four items, namely numbers 16, 38, 47, and 60, were declared inappropriate. A total of 59 other items were stated following the normal function and could be understood correctly by every student.
The following item analysis is to analyze the understanding of the answer choices provided. The analysis carried out by looking at the rating table (partial credit) scale with the provisions that the observed average and Andrich threshold values show suitability and increase the choice of answers, which have a scale from 0 to 5.
The analysis results are shown in Table 3, where the values match the increase in the rating scale. Thus, the differences in answer choices 0, 1, 2, 3, 4, and 5 can be understood by the participants.
The last analysis analyzes the item bias to determine that the items used to measure mental health in adolescents do not benefit individuals' specific categories. Items are said to be biased if they have a probability value below 0.05. Based on the results of the analysis on the item table: DIF, between / within, it is found that 40 items have a bias.
3.4. Ability Analysis
Ability analysis is performed by analyzing individual ability and the suitability of individual answers with their ability. The person measure table is used to determine the categories of high, medium, and low ability. Meanwhile, in the analysis of the level of individual suitability, the person fit order table is used to analyze the suitability of students' answers to their ability.
| - | Empirical | Modeled | ||
|---|---|---|---|---|
| Total raw variance in observation | 99.2 | 100.0% | 100.0% | |
| Raw variance explained by measures | 36.2 | 36.5% | 36.7% | |
| Raw variance explained by persons | 3.0 | 3.1% | 3.1% | |
| Raw variance explained by items | 33.2 | 33.4% | 33.6% | |
| Raw unexplained variance (total) | 63.0 | 63.5% | 100.0% | 63.3% |
| Unexplained variance in 1st contrast | 8.9 | 9.0% | 14.2% | |
| Unexplained variance in 2nd contrast | 3.5 | 3.5% | 5.5% | |
| Unexplained variance in 3rd contrast | 2.8 | 2.8% | 4.5% | |
| Unexplained variance in 4th contrast | 2.0 | 2.0% | 3.2% | |
| Unexplained variance in 5th contrast | 1.9 | 2.0% | 3.1% | |
| Category | Observed | Observed Average | Sample Expect | Infit MNSQ | Outfit MNSQ | Andrich Threshold | Category Measure | ||
|---|---|---|---|---|---|---|---|---|---|
| Label | Score | Count | % | ||||||
| 0 | 0 | 41 | 0 | 1.09 | 0.44 | 1.80 | 2.15 | None | (-5.00) |
| 1 | 1 | 3372 | 10 | 0.73* | 0.60 | 1.22 | 1.37 | -3,89 | -1.89 |
| 2 | 2 | 5072 | 15 | 0.75 | 0.82 | 0.83 | 0.81 | 0,12 | 0.12 |
| 3 | 3 | 7784 | 23 | 1.05 | 1.13 | 0.84 | 0.81 | 0,54 | 0.93 |
| 4 | 4 | 9329 | 28 | 1.57 | 1.53 | 0.84 | 0.85 | 1,15 | 1.81 |
| 5 | 5 | 7728 | 23 | 1.92 | 1.91 | 1.03 | 1.05 | 1,91 | (3.28) |
The individual ability analysis was performed by looking at the person measure table. The condition that must be met to obtain an individual's ability category is to combine the standard deviation with the average value. Thus, the logit value limit for the high ability category is more than 1.58, the moderate ability category starts from 1.06 to 1.58, and the low ability category is less than 1.06. The results showed that 26 Malaysian students had a high level of ability, 111 Malaysian students had a moderate ability, and 34 Malaysian students had a low ability. Meanwhile, 31 Indonesian students had a high ability, 317 Indonesian students had a moderate ability, and 11 Indonesian students had a low ability.
Furthermore, to analyze the answers' suitability with individual abilities, the person fit table is used. The analysis was carried out with the provisions stated by Boone et al. (2014) that the value of (1) MNSQ OUTFIT value is more significant than 0.5 but smaller than 1.5 and the closer to 1, the better; (2) ZSTD OUTFIT value greater than -2.0 and smaller than +2.0, and the closer to 0 the better; and (3) the value of PT MEASURE CORR is more than 0.4 and less than 0.85. A participant can be considered fit if they meet at least 1 of the three criteria. Based on these criteria, it is known that as many as 39 Malaysian students gave answers that were not according to their level of ability and 18 Indonesian students gave answers that were less than their level of ability.
3.5. Instrument Analysis
Instrument analysis is carried out by observing statistical summary tables.
The results shown in Tables 4 and 5 indicate that a person's mean value is greater than the average item. Therefore, the ability of the respondent is generally more significant than the difficulty of the instrument items. Paying attention to the Cronbach alpha value, person reliability, and item reliability shows that the interaction between the person and the items on the instrument is in the good category. The consistency of the respondent's answer is also in the good category. The quality of the items in the instrument has a particular category. Paying attention to the INFIT column and also OUTFIT in the statistical summary table, it is found that the person and item have an average approaching the ideal criteria and have good quality. Furthermore, the separation or grouping of persons and items shows that the study participants have a diversity of abilities categorized into two groups. Meanwhile, the item difficulty level was spread out into 19 groups ranging from the easiest to the most challenging groups.
Regarding the measurement result/measurement focus information, an image is obtained, as shown in the Fig. (1).
| Total Score | Count | Measure | Model Error | Infit | Outfit | |||
|---|---|---|---|---|---|---|---|---|
| MNSQ | ZSTD | MNSQ | ZSTD | |||||
| Mean | 213.3 | 63.0 | 1.32 | 0.12 | 1.01 | -0.5 | 1.03 | -0.4 |
| S.D. | 15.7 | 0.0 | 0.26 | 0.01 | 0.57 | 3.1 | 0.63 | 3.0 |
| Max. | 305.0 | 63.0 | 3.94 | 0.32 | 5.68 | 9.9 | 7.53 | 9.9 |
| Min. | 138.0 | 62.0 | 0.18 | 0.12 | 0.1 | -7.8 | 0.18 | -7.7 |
| Real RMSE | 0.14 | True SD | 0.22 | Separation | 1.61 | Person Reliability | 0.72 | |
| Model RMSE | 0.12 | True SD | 0.23 | Separation | 1.86 | Person Reliability | 0.78 | |
| S.E. of Person Mean = 0.01 | ||||||||
| Total Score | Count | Measure | Model Error | Infit | Outfit | |||
|---|---|---|---|---|---|---|---|---|
| MNSQ | ZSTD | MNSQ | ZSTD | |||||
| Mean | 1790.9 | 529.0 | 0.00 | 0.04 | 1.03 | -0.4 | 1.03 | -0.2 |
| S.D. | 386.0 | 0.1 | 0.68 | 0.01 | 0.34 | 4.0 | 0.33 | 4.0 |
| Max. | 2389.0 | 529.0 | 1.08 | 0.06 | 2.57 | 9.9 | 2.46 | 9.9 |
| Min. | 1138.0 | 528.0 | -1.30 | 0.04 | 0.54 | -8.8 | 0.57 | -8.1 |
| Real RMSE | 0.05 | True SD | 0.68 | Separation | 14.24 | Item Reliability |
1.00 | |
| Model RMSE | 0.04 | True SD | 0.68 | Separation | 15.22 | Item Reliability | 1.00 | |
| S.E. of Person Mean = 0.09 | ||||||||
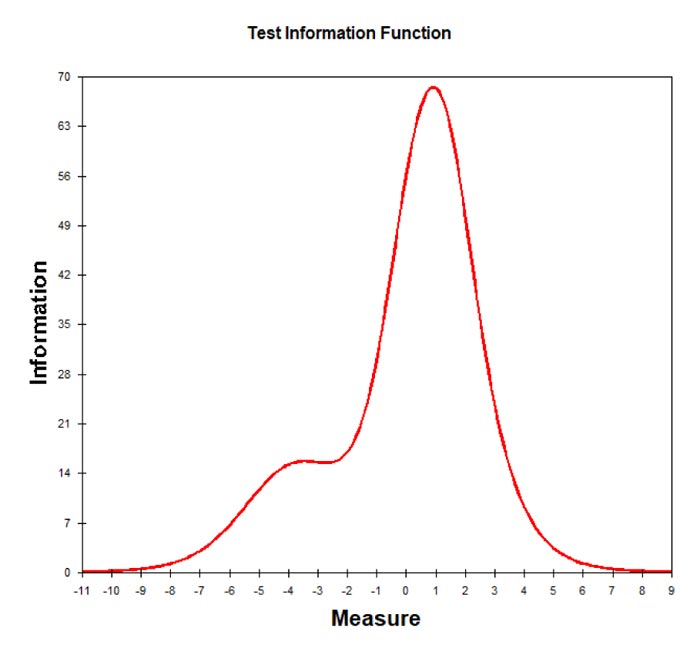
The test information function indicates that mental health instruments are more likely to produce information that describes participants who fall into the high category.
4. DISCUSSION
Unidimensionality is a measure to evaluate whether the instrument can measure what it should be measured, namely, the American Screening Tools Mental Health instrument [20, 23]. Rasch Model analysis is used with a principal component analysis of the residuals, which measures the instrument's diversity. The measurement results show that the raw variance has a not much different value and even tends to be the same as the expected value. It shows that the unidimensionality requirement of 20% can be fulfilled [24, 25]. Also, the results show that each unexplained variance indicates that the items contained in the instrument can measure each dimension because they have a value below 15% [25]. That way, the results of the instrument's unidimensionality test can guarantee that the instrument's construct validity is in line with expectations.
Mental health impacts the awareness of one’s skills, coping with the stresses of everyday life, working efficiently, and contributing to one’s surroundings. It also includes the individual's ability to enjoy life and create a balance between life activities and efforts to achieve psychological resilience [26]. The instrument's construct's accuracy will provide an accurate picture so that it can provide appropriate interventions regarding individual mental health needs [27, 28].
Based on the Wright Map analysis results, the mental health of Indonesian and Malaysian students shows that the mental health profiles of Indonesian and Malaysian students are above the average difficulty level of the item standard. This mental health condition shows that students from Indonesia and Malaysia, on average, tend to have good mental health. They tend to be able to cope with stresses in life, such as depression and other factors, and be productive and contribute to their social environment [17].
The formation of these mental health conditions cannot be separated from certain factors, including cultural, social, and educational factors [29]. These factors cause differences in mental health conditions; therefore, there are differences in ability between Indonesian and Malaysian students.
The results of the item analysis show that the items have an even distribution of categories. The spread is a determinant that items can get a picture of the results that describe students who have specific abilities [30, 31].
The instrument analysis results showed that the instrument was of good quality to be used as a tool to measure mental health in adolescents. With the interaction between the person and items included in the good category, the respondent's answer's consistency is also in the sufficient category, and the quality of the items in the instrument has a special category. The instrument can be said to be following the provisions [25]. Therefore, overall, the American Mental Health Screening Tools instrument can be good enough to identify the mental health of Indonesian and Malaysian adolescents.
CONCLUSION
In the unidimensional analysis, it can be said that the instrument can measure all dimensions. The first unexplained variant value characterizes each dimension's measurability to the 5th residual contrast below 15%. However, the raw variance explained by the size indicates a good category, with a value of 36.2%.
Items on the instrument were analyzed to see their quality. The Wright Map analysis results show that the respondents' abilities are at + 1SD and + 2SD. Also, items on the instrument are not outliers or have a difficulty above + 2SD. Thus, mental health instrument items are quickly approved by Indonesian and Malaysian students. Analysis of the respondent's ability was also conducted to determine the respondent's ability and suitability level.
Based on the results of the analysis using the RASCH model, it can be concluded that the Screening Tools Mental Health tool is good enough to measure mental health.
ETHICS APPROVAL AND CONSENT TO PARTICIPATE
This study was approved by Indonesia Guidance and Counseling Association (ABKIN) Jawa Barat, Indonesia under approval no. 07/ABKIN Jabar/05/2020.
HUMAN AND ANIMAL RIGHTS
No Animals were used in this research. All human research procedures were followed in accordance with the ethical standards of the committee responsible for human experimentation (institutional and national), and with the Helsinki Declaration of 1975, as revised in 2013.
CONSENT FOR PUBLICATION
Informed consent is obtained from the participants.
AVAILABILITY OF DATA AND MATERIALS
The authors confirm that the data supporting the findings of this research are available within the article. If the readers need more data. please contact the corresponding author [D.S] for permission.
FUNDING
Letter of Agreement on the Implementation of the Research Grant Program in the Indonesian Education University Environment in 2020 between the Chair of the Research and Community Service Institute at the University of Education of Indonesia and the Chair of Research, Lecturer, University of Education of Indonesia Number: 706 / UN4O.D / PT / 2020
CONFLICT OF INTEREST
The author states that there is no conflict of interest, financial or otherwise.
ACKNOWLEDGEMENTS
Thank you to Universitas Pendidikan Indonesia, who has given us a chance to carry out this research. Thanks to the UPSI lecturers and students in Malaysia who have contributed to this research.